


![]()
![]()
![]()
![]()
![]()
![]()
![]()
Binance Coin (BNB) price prediction has recently demonstrated signs of steady upward movement, supported by multiple bullish technical signals across short- and long-term charts.
The price has held within a tight range over the last 24 hours, showing signs of strength despite market-wide volatility.
Data from the 24-hour chart confirms that BNB registered a 1.01% gain over the 24 hours ending July 1, 2025, closing at $654.51. Technical divergence patterns, rising indicators, and liquidations favoring longs have positioned the asset in a potentially bullish structure heading into the new quarter.
Divergence Patterns Highlight Trend Continuation
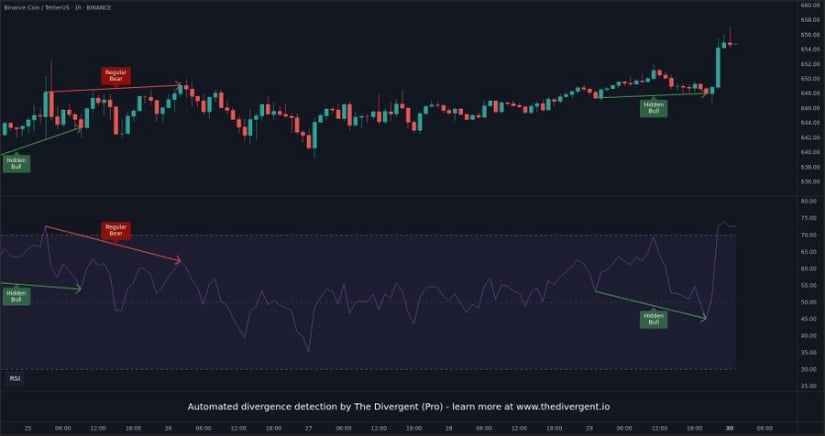
A recent update shared by @WhiteboxTrading on X emphasized a key hidden bullish divergence on the 1-hour chart of BNB/USDT, identified using The Divergent Pro tool. This divergence occurred when BNB’s price action formed a higher low, while the Relative Strength Index (RSI) printed a lower low.
Such patterns are typically interpreted as signs that the existing trend—in this case, upward—may continue. Shortly after this divergence appeared, BNB’s price moved upward sharply, confirming the potential accuracy of the signal.
Source: X
This divergence followed a regular bearish divergence earlier in the month, where price formed higher highs while RSI showed lower highs, signaling a weakening trend. The bearish signal resulted in a short consolidation period, followed by renewed buying interest.
Two additional hidden bullish divergences were observed on June 26 and June 29, both reinforcing the ongoing uptrend. As a result, BNB rose past short-term resistance, touching a peak of $656 and solidifying its trend continuation structure.
Market Metrics Support Short-Term Strength
According to Brave New Coin data, BNB’s market capitalization currently stands at approximately $95.5 billion, with a circulating supply of 145,887,575 tokens. Over the past 24 hours, the asset has shown relatively low volatility, with the price fluctuating between $652 and $658.
The 24-hour trading volume is recorded at $453.76 million, with peak volume hitting $743.83 million during a short-term rally near the close of June 30. This surge in volume was accompanied by price movement toward $658, followed by a retreat to $654.51, possibly indicating profit-taking activity.

Source: Brave New Coin
Price action on June 30 began around $654, climbed gradually to the $656 mark, and then pulled back to intraday lows near $652. Toward the end of the session, BNB rebounded to approach $658 before settling near its current level.
The overall movement suggests consolidation within a bullish context, supported by consistent trading volume and buyer interest. The data points to cautious but steady accumulation among holders, as the price remains anchored above key psychological support levels.
In a separate update posted by @cryptozone_x on X, liquidation alerts indicated that short positions on BNB were being closed at $657.00 on Bybit, amounting to $91,330 in buying activity. This coincided with other short liquidations across major pairs and platforms. Such liquidation data often reflects strong momentum as price forces shorts to exit, adding to buying pressure and supporting upward movement.
Technical Indicators Point Toward Potential Breakout
On the daily chart, Binance price closed at $656.91 on June 30, marking a 0.31% increase for the day. The price reached a high of $660.00 and a low of $651.17, suggesting limited volatility but a positive bias. The chart also shows that BNB has been consolidating since May, following a broader recovery that began in March.
The price remains within a wide historical range, with previous extremes recorded at $745.29 (high) and $500 (low). The current range-bound structure reflects market hesitation, but with growing bullish indicators emerging.

Source: TradingView
The Bollinger Band Power (BBP) indicator has turned positive with a reading of 16.67, marking a shift in momentum. Earlier in the year, BBP remained in negative territory, particularly during February and March, when BNB traded below the lower Bollinger Band.
The recent positive reading suggests that price is gaining strength within its range. While not yet in overbought territory, the sustained green bars in the BBP histogram may signal increased buying interest if accompanied by continued volume support and a move past local resistance.
The Relative Strength Index (RSI) is currently at 55.30, while its moving average stands at 46.75. This positioning reflects growing strength in the asset, but not at an overextended level. The RSI crossing above its moving average is commonly viewed as a buy signal, particularly when price action is stable or trending upward.
With BNB price prediction trading near resistance but holding strong RSI levels, the potential for an upward breakout remains, provided market conditions stay favorable.