


![]()
![]()
![]()
![]()
![]()
![]()
![]()
This is a daily technical analysis by CoinDesk analyst and Chartered Market Technician Omkar Godbole.
Bitcoin’s
price chart is showing a well-formed “bull flag,” suggesting a potential breakout to new lifetime highs consistent with some traders’ expectations for a price rally to $140,000 and higher.
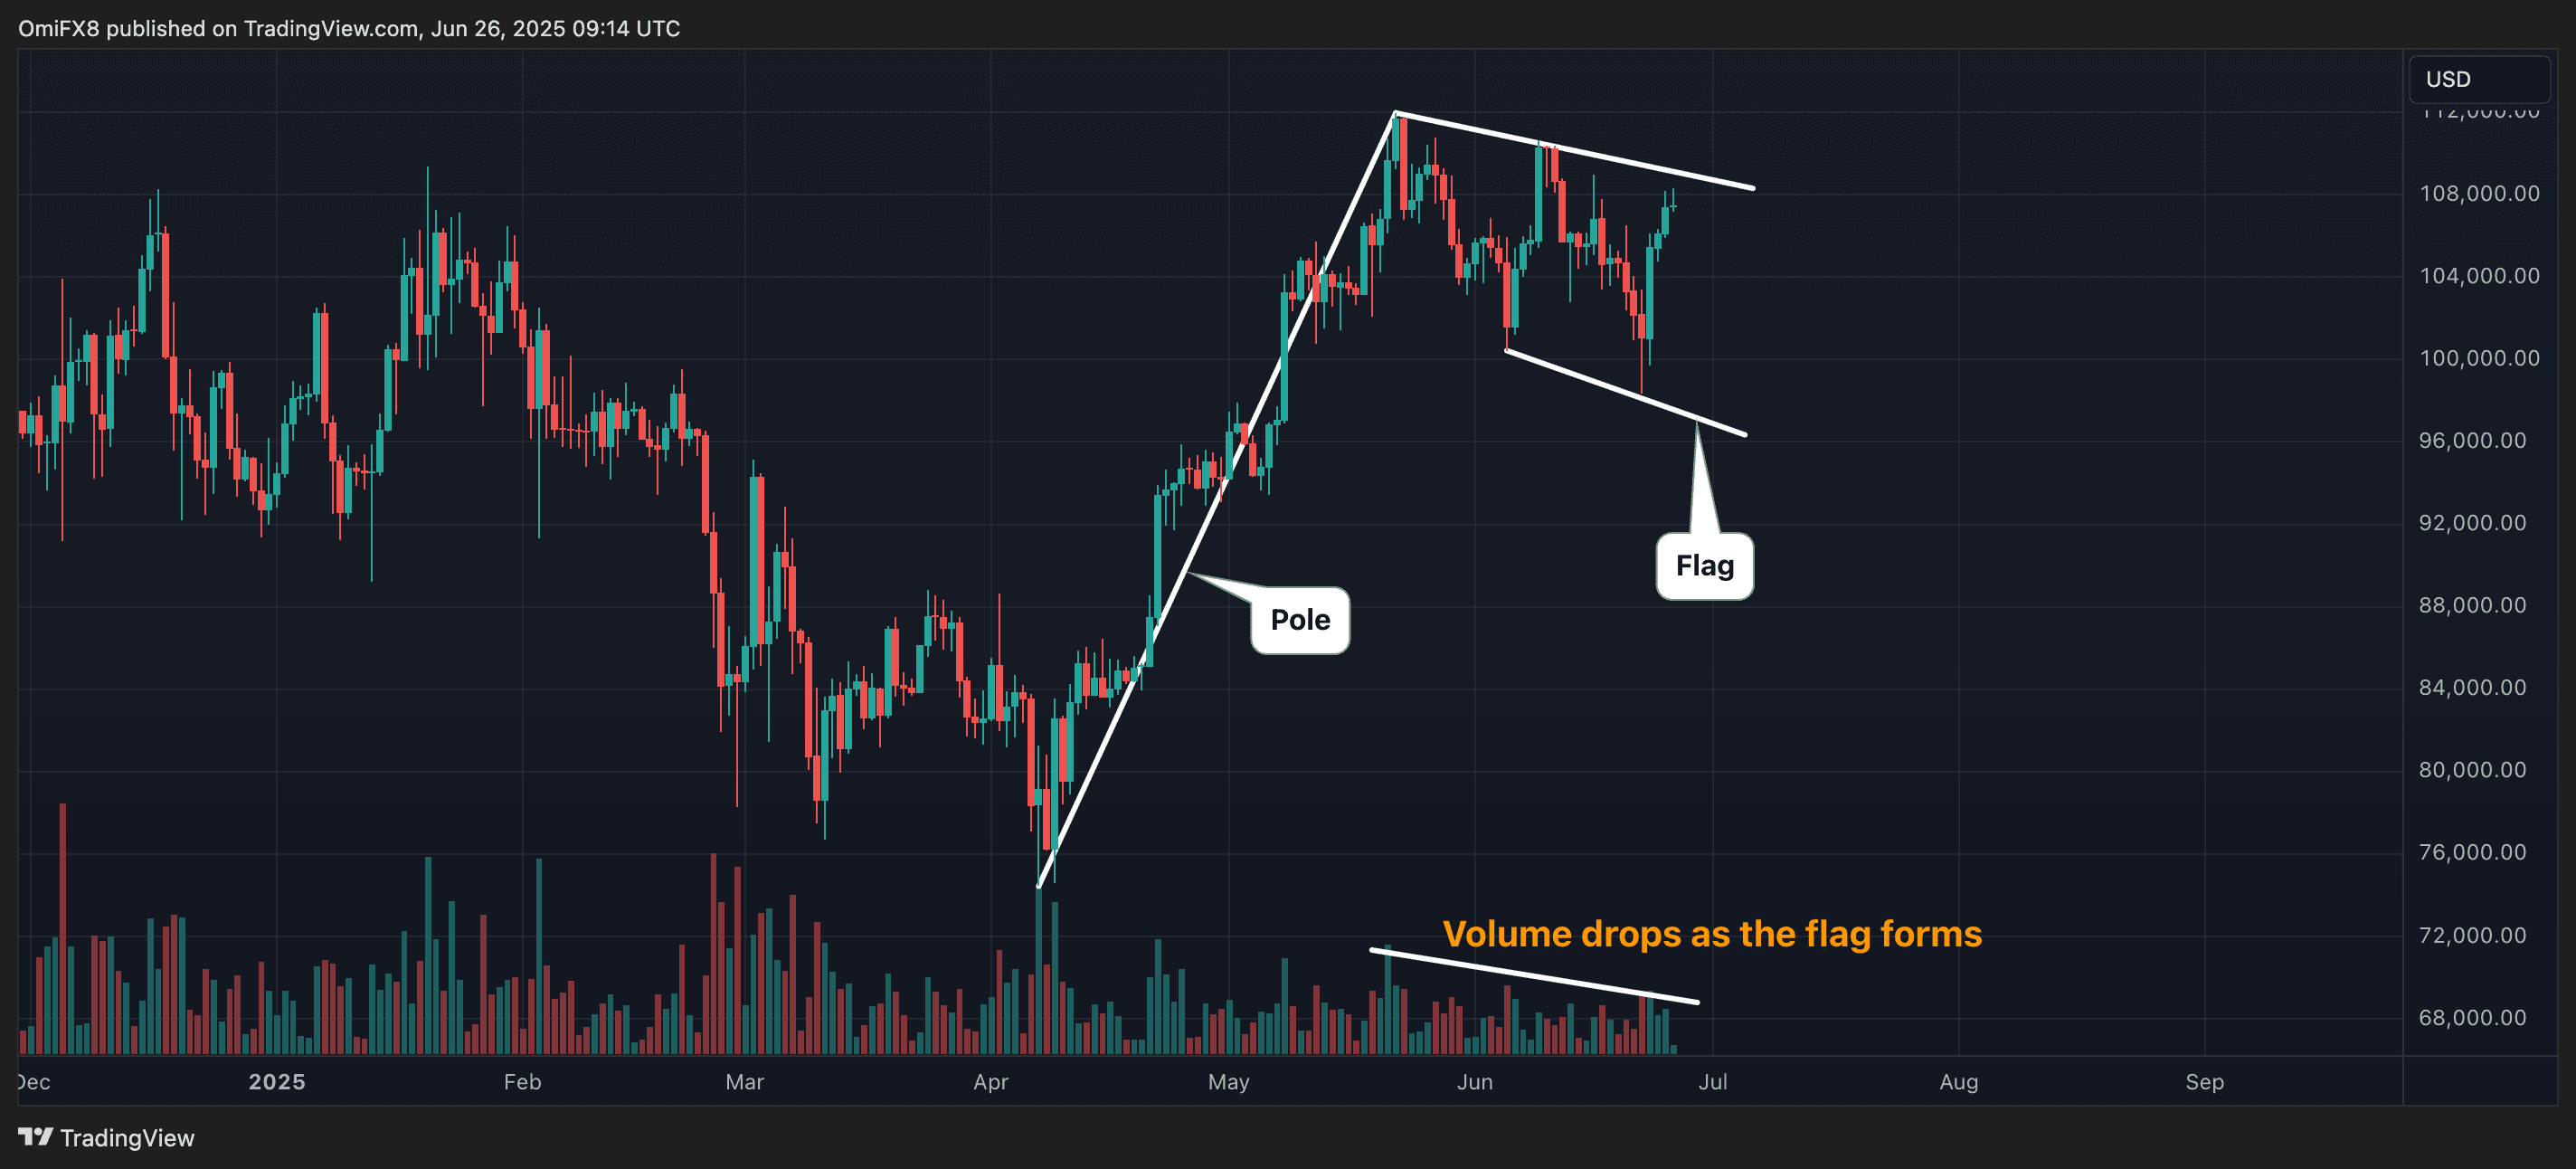
BTC surged to a record high of nearly $111,900 from around $74,700 over the course of the six and a half weeks ended May 22, and has since traded in a mildly descending range, forming the bull flag, according to charting platform TradingView. The flag is identified by trendlines connecting the highs hit on May 22 and June 9 and the lows reached on June 5 and June 22. Meanwhile, the pole is represented by the initial surge.
A move above $109,000 is needed to confirm the bull breakout, which would open the door for a rally to $146,000. The level is calculated by adding the length of the pole —the initial surge — to the breakout point, using a method technical analysts call a measured move.
A bull flag pattern represents counter-trend, low-volume consolidation within a narrow range, preceded by a sharp increase. The consolidation tends to be smaller in magnitude and duration than the preceding rally, helping to relieve short-term overbought conditions and recharge the bulls’ engines for the next leg higher.
“Flag formations occur over a short period — usually a few days to few weeks,” Charles D. Kirkpatrick wrote in his book, Technical Analysis: The Complete Resource for Financial Market Technicians. “Volume usually declines throughout the formation of the flag.”
“[However], it is important to be cautious to make sure that a complete formation has occurred and to wait for the breakout,” Kirkpatrick noted.
Flags are continuation patterns, and so the consolidation is expected to resolve in the direction of the preceding uptrend.
Still, failures can occur in two ways. First, prices can dive out of the flag, marking a bearish reversal. Second, a bullish breakout can fail, which calls for continuous monitoring of the price action.
That said, failure rates are low, according to Kirkpatrick.
“Because these patterns have low failure rates, few pullbacks or throwbacks, short time periods, and steep trends preceding and following their occurrences, they are very good trading patterns,” Kirkpatrick noted.