


![]()
![]()
![]()
![]()
![]()
![]()
![]()
Chainlink (LINK) is showing early signs of stabilization after a volatile start to July. A strong bounce off local lows near $12.90 has brought the asset back above key short-term resistance levels, with volume and momentum indicators reflecting increased trader engagement.
As LINK hovers near the $13.50 zone, analysts are closely watching for further confirmation of a potential trend reversal. Current indicators now suggest that momentum may be shifting toward the upside.
Price Holds Above Key Support After Bullish Breakout
On the hourly chart, LINK has confirmed a short-term bullish breakout after forming a series of higher lows. Price accelerated beyond the $13.40 mark and briefly touched $13.70 before consolidating near $13.48. This movement followed a clear rebound from the July 2 low at $12.90, forming a rounded bottom pattern that typically precedes continued upside.
The pullback following the intraday peak is characteristic of cooling after an aggressive move, allowing the market to reset while preserving a bullish structure.
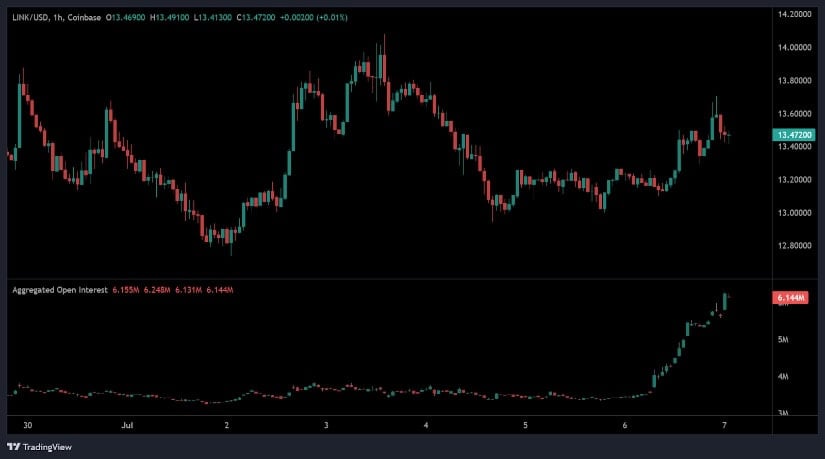
Source: Open Interest
Open interest in LINK derivatives surged significantly during this phase, rising from under 3.5 million to over 6.1 million contracts. This near-doubling of participation in just 24 hours points to heightened speculation and hedging activity. When combined with rising prices and stable funding, this open interest expansion supports the case for a sustainable bullish leg.
Additionally, increased volume in the $13.20–$13.40 zone reinforces the breakout, with this range now likely to act as support in case of a retest.
Resistance levels remain in focus as LINK trades within a narrow range. Price must clear $13.75 and then $14.00 to continue the upward trend. If these levels are broken with high volume, LINK may revisit the $15–$16 region in the near term. Conversely, any failure to hold above $13.20 could trigger renewed downward pressure and reintroduce the possibility of retesting earlier July lows.
Chainlink Price Prediction: Technical Momentum Signals Begin to Strengthen
Chainlink’s daily chart structure reflects an ongoing consolidation between mid-range support and historical resistance. The current price of $13.48 positions LINK near the midpoint of its multi-month range, which stretches from a low of $10.10 to a high near $19.53. The overall sideways price movement, though lacking a decisive trend, has allowed momentum indicators to reset and now gradually shift in favor of bulls.
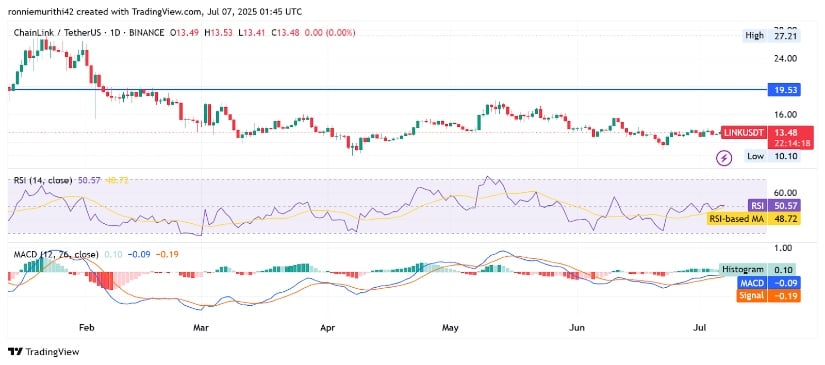
Source: TradingView
The Relative Strength Index (RSI) currently stands at 50.57, marginally above the neutral 50 mark and its own moving average of 48.72. This placement suggests emerging bullish interest as RSI climbs from previously oversold conditions. A confirmed move into the 55–60 RSI zone would indicate increasing buying pressure and possibly mark the beginning of a medium-term rally.
This shift comes after several weeks of indecision, providing traders with new potential entry points should the momentum continue to build.
In addition, the Moving Average Convergence Divergence (MACD) is showing initial signs of recovery. With the MACD line nearly aligned with the signal line and the histogram turning green at 0.10, bearish momentum appears to be waning. If the MACD crosses above the zero threshold in the coming sessions, it could reinforce the bullish setup and add credibility to a price move beyond $14.00.
Wider Market Dynamics Support Near-Term Recovery
According to data from the past 24 hours, LINK posted a 1.96% gain, supported by over $216 million in trading volume. The price moved from a low of $13.12 to a peak of nearly $13.70 before settling into a higher range. Volume spikes occurred during upward movement, reflecting active buyer participation during breakout phases. Market cap has risen to $9.13 billion, placing LINK 17th among the top cryptocurrencies by valuation.
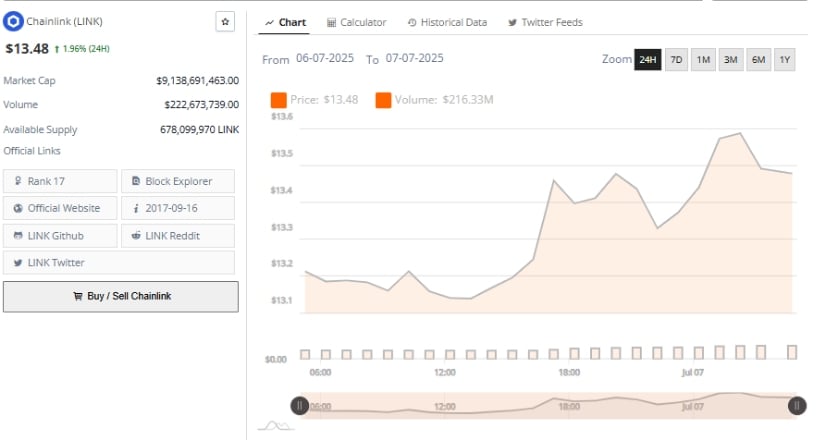
Source: BraveNewCoin
The asset continues to show resilience despite broader market fluctuations. Should LINK sustain its current trajectory and build on improving volume and technical momentum, the possibility of a push toward the $16–$19 region increases. Traders will closely monitor resistance at $14.00 and the RSI’s movement beyond the 55 level as indicators of further strength.