


![]()
![]()
![]()
![]()
![]()
![]()
![]()
Chainlink (LINK) is currently hovering near the $13.20 level, where signs of buyer interest have started to emerge.
The token recently displayed notable bullish divergence across multiple timeframes, despite ongoing price weakness.
While broader market conditions remain cautious, key indicators suggest that an accumulation phase may be forming at the current support zone. With price consolidating and sentiment neutral, traders are closely watching for any sign of directional confirmation.
Bullish Divergence Signals from Analysts on X
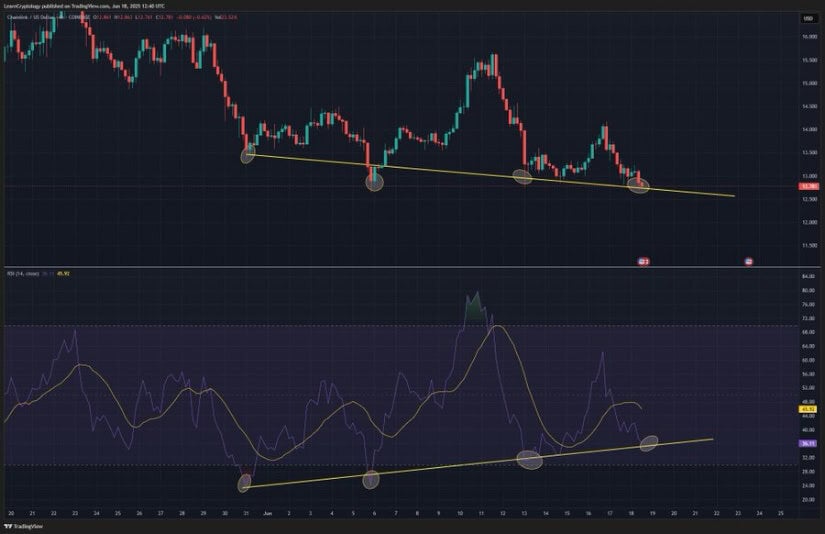
In a recent post on X, analyst CryptoCracker (@LearnCryptology) presented a detailed 4-hour chart analysis of Chainlink Price Prediction, pointing out what he referred to as a “Bullish Divergence X4.” This formation tracks four successive lower lows in price, matched with four higher lows on the RSI, as it develops along a steady support trendline around the $13.20 mark.
According to the analyst, this structure reflects a repeated pattern of buyers stepping in at key support levels despite broader bearish sentiment, potentially signaling the beginning of an accumulation phase.
Source: X
The RSI reading on the chart posted by CryptoCracker stands around 38.11, showing consistent upward movement in contrast to declining price levels. This divergence suggests a weakening of bearish pressure over time, even as price tests lower ranges.
While no breakout has been confirmed, the RSI’s trajectory may indicate early signs of underlying momentum shifting toward buyers. CryptoCracker concluded that a breakout above recent highs, combined with rising RSI and volume, would be necessary to validate the bullish thesis and signal a short-term reversal.
Chainlink Price Prediction: Volume, Price Action, and On-Chain Trends
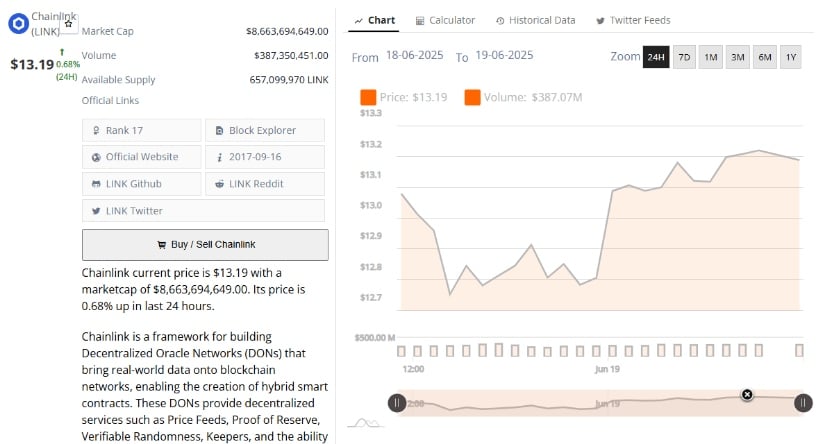
On the one hand, data from Brave New Coin indicates that Chainlink’s current price has stabilized around $13.19, with a modest 0.68% increase in the past 24 hours. During this period, trading volume reached approximately $387 million, indicating consistent market activity.
Source: Brave New Coin
The intraday chart reveals price movement between $12.70 and $13.19, indicating mild volatility and a recovery from session lows. This pattern aligns with typical accumulation behavior, where price remains within a defined range amid balanced buying and selling pressure.
In another X post, analyst Enclave (@encl4ve) highlighted a divergence between LINK’s on-chain utility and its market price. He noted, “Despite languishing price, Chainlink Total Value Secured continues to make new highs.” This statement points to a broader trend where LINK’s token value may not fully reflect the growing adoption of its decentralized oracle networks (DONs).

Source: X
The discrepancy could be attributed to short-term market dynamics or a structural decoupling between protocol fundamentals and token valuation. As DON usage continues to expand, the market may eventually adjust to reflect the platform’s utility more accurately.
Weekly Outlook from TradingView Indicates Cautious Sentiment
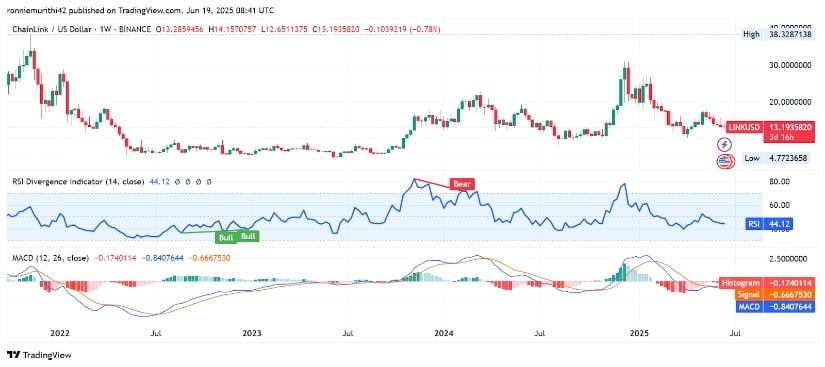
On the other hand, the weekly chart for LINK/USD Price Prediction on TradingView shows a consolidation structure that has taken shape following a corrective move from the $20 resistance zone. After recovering from a historical low near $4.77, LINK has struggled to maintain upward momentum and is currently trading around $13.19.
The recent candlestick patterns reflect indecision, with no dominant trend established in either direction. Price action continues to form lower highs and lower lows, highlighting uncertainty among market participants.
Source: TradingView
The Relative Strength Index (RSI) on the weekly timeframe stands at 44.12, indicating a neutral-to-bearish stance. A previously noted bearish divergence, where RSI made a lower high as the price reached a higher peak, led to the current consolidation phase.
Meanwhile, the MACD (Moving Average Convergence Divergence) indicator shows the MACD line below the signal line, accompanied by negative histogram bars. These elements confirm prevailing downward pressure, although they are not signaling an aggressive sell-off. For LINK to shift its weekly trend, a decisive move above resistance levels backed by positive momentum indicators would be required.
Overall, the current technical setup around $13.20 highlights a possible accumulation zone for Chainlink. However, confirmation of a directional move will depend on upcoming volume trends, sentiment shifts, and broader market behavior.