


![]()
![]()
![]()
![]()
![]()
![]()
![]()
Dogwifhat (WIF), a meme-inspired cryptocurrency on the Solana blockchain, is showing renewed bullish activity following a short-term price rally
The token has recorded a 4.25% increase in the past 24 hours, bringing its market capitalization to approximately $886.9 million. Supported by a notable rise in trading volume and improving momentum indicators, WIF is attracting the attention of traders seeking short-term volatility and potential breakout opportunities.
While price action remains below previous highs, the recent upward movement, coupled with increasing open interest and steady volume, signals improving sentiment. However, broader technical conditions suggest that sustained gains will depend on continued participation and key resistance levels being reclaimed.
1-Hour Chart Reflects Volatility and Short-Term Recovery Attempts
The 1-hour WIF/USD chart from Coinbase shows a volatile series of moves throughout early June. The token experienced a steep drop at the end of May, followed by a stabilization period between June 1 and 2. A sharp bullish breakout occurred on June 3, with the price temporarily exceeding $1.00 before facing resistance. The retracement that followed suggests a classic pump-and-fade pattern, indicating difficulty in holding levels above key psychological zones.
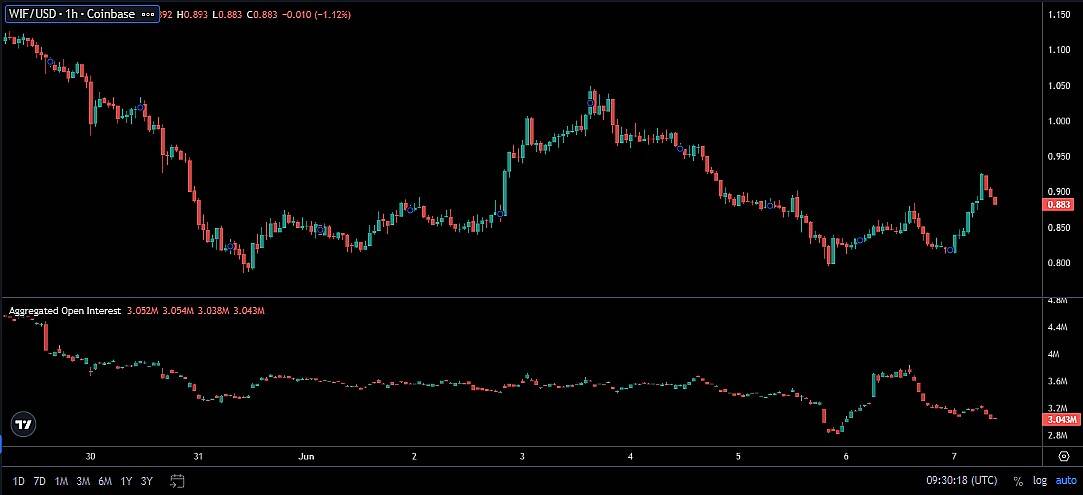
Source: Open Interest
From June 4 to 6, the price structure reflected weakness, forming lower highs and lower lows indicative of a short-term bearish bias. A brief recovery spike occurred in early June 7, pushing the price to $0.90 before another rejection. At the time of reporting, WIF is trading near $0.883 after a slight intraday loss of 1.12%. This behavior suggests hesitation among short-term traders, with no clear directional conviction in the current range.
The Aggregated Open Interest (OI) indicator shows fluctuating trader participation. OI remained low prior to the June 3 rally, surged during the breakout, and then dropped as prices corrected. The recent uptick in OI accompanying the June 7 price rebound hints at fresh speculative entries. However, the rapid decline in OI afterward implies reduced follow-through, suggesting that momentum has yet to stabilize on the shorter timeframes.
24-Hour Metrics Signal Active Participation and Strong Support
Additionally, in the last 24 hours, Dogifhat price prediction has registered steady gains, with price movement starting near $0.84 and peaking just above $0.91 before settling at $0.87 – up 0.51%. This upward trend was accompanied by increased trading activity, with total volume reaching approximately $245.91 million. The sustained volume throughout the session reflects solid liquidity and interest, with no signs of extreme volatility or low-volume spikes.

Source: Brave New Coin
The price rally appears to have been supported by consistent buying interest across the session. Volume peaked during key price surges and remained elevated during consolidation periods, suggesting that demand remained intact even as the token encountered resistance. This combination of rising price and high volume is generally interpreted as a sign of healthy market activity, where moves are backed by substantial participation.
With a circulating supply close to one billion tokens, Dogwifhat maintains a mid-cap status and currently ranks #104 among global cryptocurrencies by market capitalization. The recent support near the $0.85 zone has acted as a technical floor, and if that level continues to hold, it could serve as a base for further upward price movement.
However, the near-term outlook will depend on how the token handles resistance zones near $0.95 and the psychological $1.00 level.
Weekly Chart and Technical Indicators Suggest Momentum Shift
On the other hand, the weekly WIF/USDT chart on Binance presents a broader view of the token’s market structure. After a prolonged downtrend from it’s all-time high of $4.014, WIF appears to be entering a recovery phase. The current weekly candle is green, reflecting a modest 1.49% gain and indicating that bullish interest is gradually returning. This movement follows a multi-week bottoming structure formed near the $0.30 range.
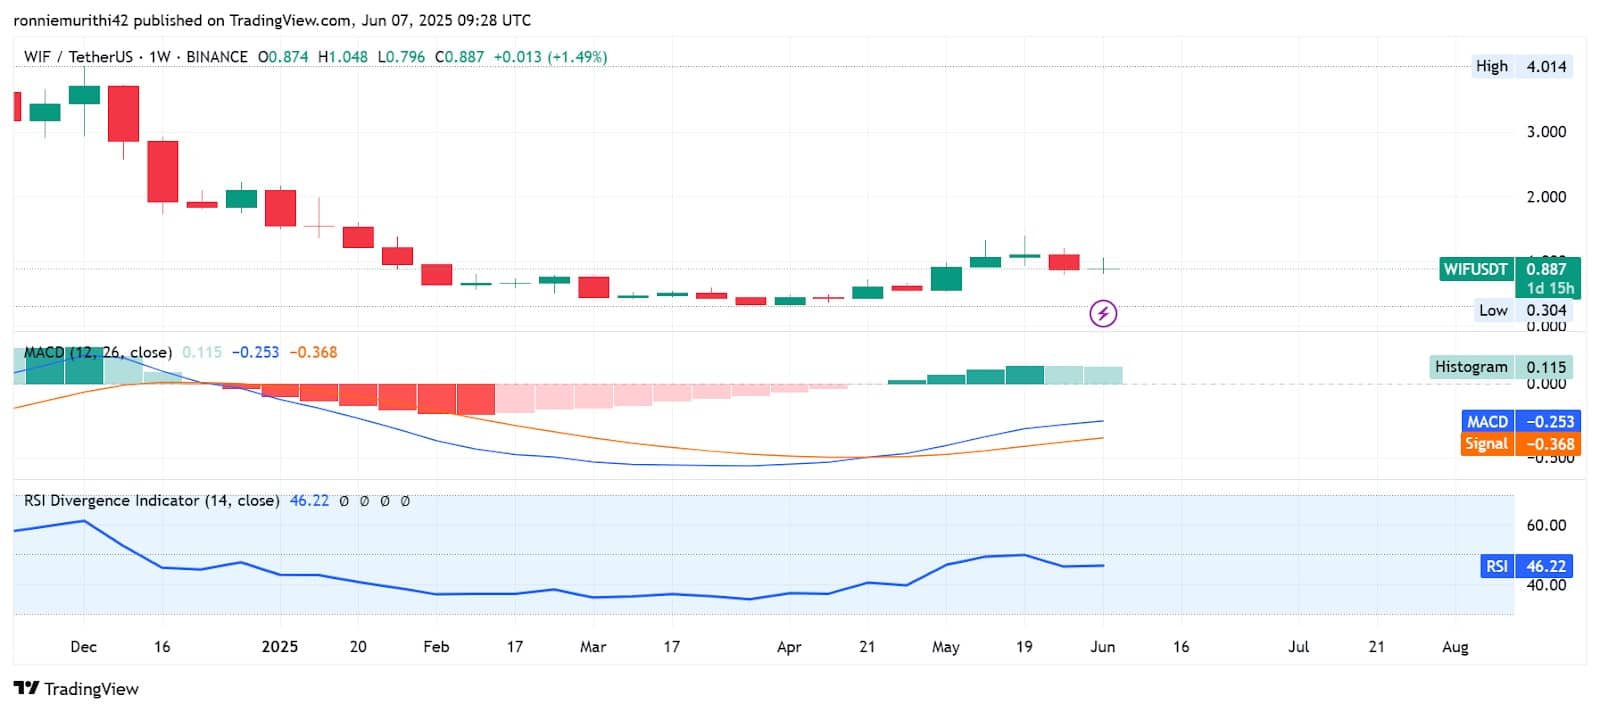
Source: TradingView
Technical indicators on the weekly timeframe support the case for emerging bullish sentiment. The MACD histogram has turned positive for the first time in weeks, printing a value of 0.115. Meanwhile, the MACD line is beginning to converge toward the signal line, suggesting that bearish momentum is weakening. A confirmed bullish crossover in the coming sessions could provide further support for a mid-term reversal.
The RSI sits at 46.22, still below the neutral 50 line but showing an upward trend since April. This suggests improving strength in buying activity, although the RSI has yet to enter definitive bullish territory. If WIF can maintain its current trajectory and break above the $1.00 resistance zone, it may initiate a more meaningful rally toward the next major levels at $1.20 and $1.35.
Outlook: Dogwifhat Price Prediction Eyes Continuation Above Key Support
The Dogwifhat price prediction remains cautiously optimistic in the short to mid-term. The current bounce, supported by a market cap nearing $887 million and strong 24-hour trading volume, suggests buyers are active and willing to defend key support levels. Technical indicators on multiple timeframes show momentum gradually shifting in favor of bulls, although confirmation will require sustained price action above $1.00.
Should volume remain elevated and open interest continue to rise, WIF could challenge overhead resistance levels in the coming sessions. However, failure to maintain support near $0.85 could trigger further consolidation or a retest of lower levels. Traders are advised to monitor momentum indicators and key price zones closely as the market gauges its next direction.