


![]()
![]()
![]()
![]()
![]()
![]()
![]()
Dogwifhat (WIF) is flashing early signs of a potential breakout, with price action tightening near a crucial support level.
After weeks of muted movement, the meme coin is now trading in a structure that has historically triggered explosive rallies.
Growing market interest and bullish chart patterns suggest that momentum is quietly building. Traders are now closely watching key levels that could mark the start of WIF’s next major move.
Analyst Spots Bullish Reversal Setup Near $0.77 Support
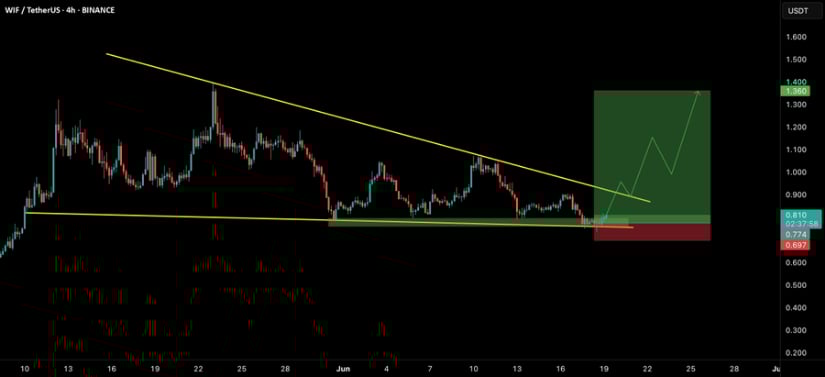
A descending triangle pattern has formed on the 4-hour WIF/USDT Price Prediction chart, with the price consolidating around a flat support zone between $0.77 and $0.78 USDT. The triangle is defined by lower highs forming resistance and a repeatedly tested horizontal base.
This pattern, typically seen as bearish, can flip bullish if the market invalidates it with a sudden breakout—a scenario that appears to be in play for WIF.
Source: X
The setup was highlighted by Crypto | #1 Free Signals (@best_analysts), who posted a chart outlining a bullish reversal trade idea. The analyst marked a green zone just above support for a potential long entry, and a red zone near $0.69 USDT as a stop-loss.
The price projection targets $1.35, representing over 70% upside. The chart includes a white path that suggests a breakout followed by a retest and continuation upward, reinforcing the idea that a breakout could trap bears and shift momentum quickly in favor of buyers.
Price Action Highlights Backed by Brave New Coin and Analyst Commentary
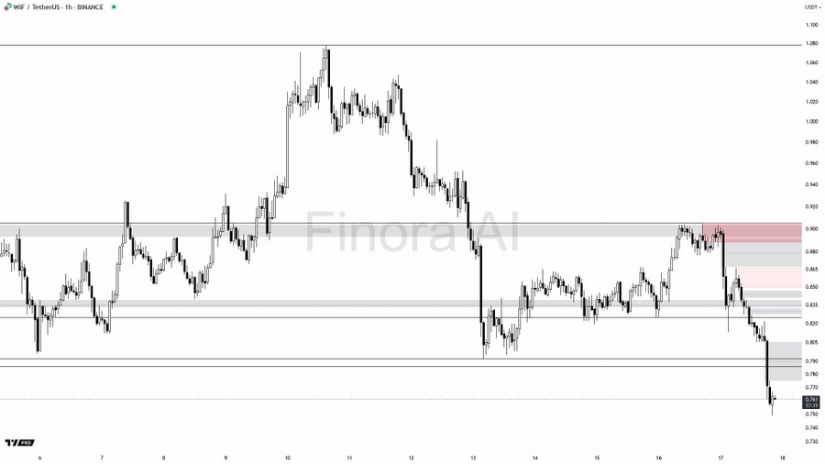
According to market data from Brave New Coin, WIF has been trading in a narrow band between $0.75 and $0.81, with daily trading volume at $291.7 million. This range-bound activity signals a possible accumulation phase, often seen before a sharp directional move. The consistent volume suggests that the meme coin still commands significant attention from the crypto community despite its recent price pullback.
Source: X
A second alert came from @TAnalystX, another trader active on X, who pointed out the bullish divergence forming on lower timeframes. They noted that WIF Price Prediction is bouncing off the 0.77 USDT level while momentum indicators show signs of recovery, often a leading signal before price catches up. Combined with Brave New Coin’s data on liquidity and order book depth, this paints a picture of a coin under pressure but with rising bullish intent.
The meme coin’s popularity within the Solana ecosystem, driven by cultural appeal and strong community engagement, continues to play a role in holding its floor. Although WIF lacks a fundamental utility angle, speculative interest and meme virality remain its primary catalysts.
Dogwifhat Price Prediction Technical View: Indicators Show Reversal Potential
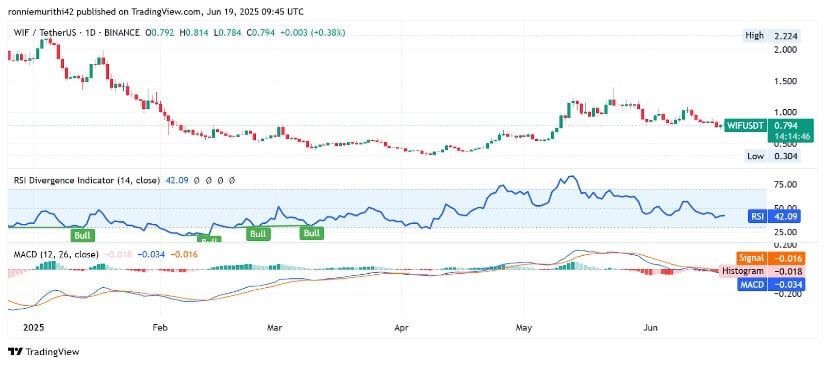
From a technical standpoint, Dogwifhat Price Prediction indicators are beginning to reflect a possible shift in sentiment. The Relative Strength Index (RSI) is currently at 42.09, just below the neutral mark of 50. While not in oversold territory, it suggests the coin is undervalued relative to its recent price action. Historically, similar RSI levels have triggered rebounds, especially when paired with chart consolidation and volume stability.
Source: TradingView
The MACD remains slightly bearish, with the MACD line below the signal line, but the histogram is flattening—a subtle sign that downward momentum is weakening. Price structure shows clear support at $0.75, with resistance levels at $0.90 and $1.00. For confirmation of a bullish reversal, traders are looking for a strong breakout above the descending triangle, followed by a retest that holds above previous resistance.
Until those conditions are met, WIF remains in a high-stakes zone. A breakout with volume could ignite a fast rally, especially with short positions caught off guard. However, a drop below $0.69 USDT would invalidate the current bullish thesis and suggest continued downward pressure.