


![]()
![]()
![]()
![]()
![]()
![]()
![]()
After experiencing a sharp decline from local highs, Floki appears to be entering a phase of stabilization.
The price action on lower timeframes shows initial signs of renewed buyer activity following an extended downtrend. This development is accompanied by subtle increases in open interest and trading volume, suggesting early signs of market re-engagement. While the broader trend remains uncertain, technical indicators point to a consolidation structure that could precede further movement to the upside if confirmed by volume and momentum.
Early Market Shifts Point to Stabilization
The 1-hour price chart for FLOKI/USDT illustrates a period of sharp sell-offs that began from levels above $0.00009500, eventually pushing the price down toward the $0.00007000 mark. This decline unfolded with consistent red candles and successive lower highs, a clear sign of strong sell-side momentum. However, the bearish pressure began to subside near the $0.00007000 support zone, where smaller candlestick bodies started forming, reflecting reduced volatility and potential buyer interest emerging at this level.
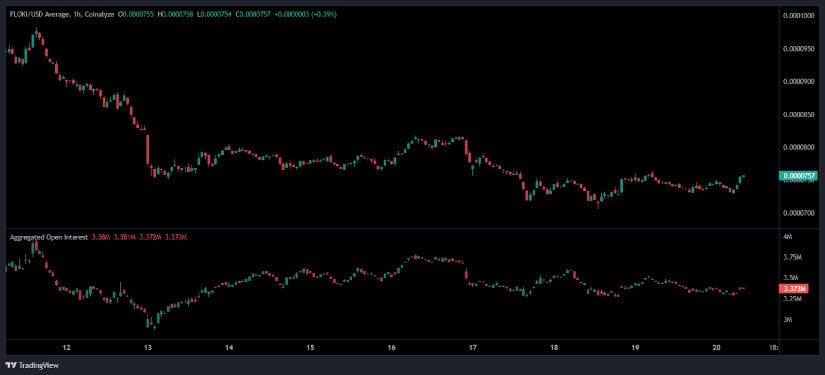
Source: Open Interest
Following the stabilization, the asset transitioned into a more neutral trading pattern. Price movements began forming higher lows, hinting at a shift in sentiment. Despite these attempts, the price encountered resistance at $0.00008000, where upward movement was consistently rejected. This resistance level acted as a cap on recovery efforts, keeping the price range-bound. Still, the structure suggests that the market is in a phase of potential accumulation, especially if volume builds above current resistance.
Open interest data offers further insight into participant behavior during this transition. During the initial decline, open interest dropped significantly, signaling that many traders exited positions amid the sell-off. As the market reached lower support levels, open interest stabilized around 3.373 M. This plateau implies that participants are cautiously returning, potentially in anticipation of a reversal. While still modest, a concurrent rise in both open interest and price could set the stage for a near-term bullish push.
Volume Growth and Price Reaction Support Breakout Signals
Additionally, the 24-hour chart paints a broader view of Floki’s Price Prediction’s recent performance. Price action held steady within a tight range between $0.00007470 and $0.00007500 for most of the session. This phase was characterized by low volatility and minimal directional conviction, aligning with a consolidation environment. Minor upticks in price occurred gradually, marked by higher lows, suggesting accumulating demand.
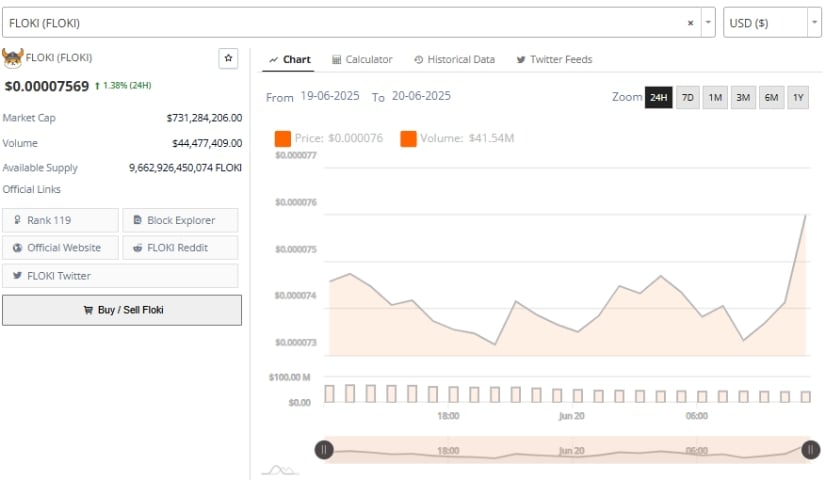
Source: Brave New Coin
A noticeable breakout emerged near the session’s end, as both price and volume surged. The price climbed to approximately $0.00007569, supported by a marked increase in daily trading volume, which surpassed $44 million. This movement indicates heightened activity and a possible breakout from the prior accumulation range. Such volume-supported moves can often precede continued upward momentum if sustained over multiple sessions.
Floki’s market capitalization currently stands at around $731 million. The combination of growing volume and increased price action within a narrow range implies that investor interest remains intact, despite previous price setbacks. However, confirmation is still required to determine whether this momentum can evolve into a sustainable trend or remain limited to short-term speculation.
Floki Price Prediction: Technical Indicators Reflect a Wait-and-See Market
On the daily timeframe, Floki Price Prediction continues to trade significantly below its peak near $0.00020688. The downtrend has been defined by a sequence of lower highs and lower lows, with the most recent candles suggesting the emergence of a support base around $0.00007500. This stabilization point has yet to produce strong bullish patterns, indicating that buying activity remains cautious.
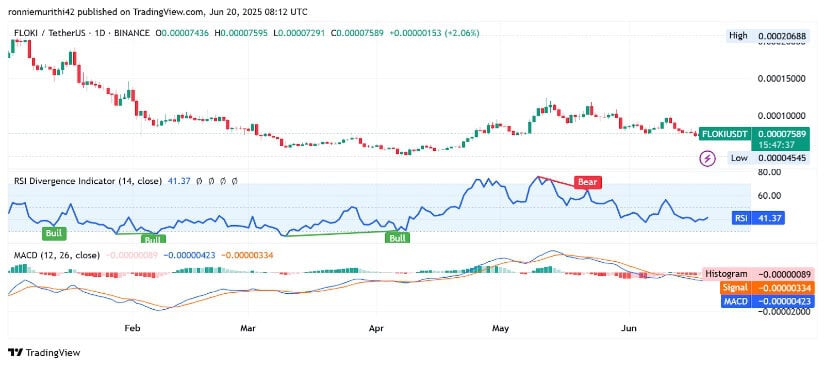
Source: TradingView
Momentum indicators provide additional clues about market direction. The RSI currently reads 41.37, which places it in a neutral range, neither confirming oversold conditions nor a strong bullish trend.
A previous bullish divergence, where RSI formed higher lows despite lower price points, failed to ignite a sustained rally. More recently, a bearish divergence—marked by lower RSI highs amid price attempts to climb—preceded the ongoing consolidation, reflecting weakened momentum.
The MACD histogram hovers near the zero line, while the MACD line remains slightly below the signal line. This configuration suggests a market lacking a strong directional bias. Although bearish momentum has diminished, no bullish crossover has occurred to signal an imminent reversal. For bullish continuation, the price would need to surpass resistance levels established earlier in May, supported by clear volume and momentum signals.
As Floki consolidates within a narrowing range, the market remains in a state of cautious optimism. While the groundwork for an uptrend is forming, confirmation from technical indicators and volume patterns will be necessary before a clearer directional move can be established.