


![]()
![]()
![]()
![]()
![]()
![]()
![]()
Optimism (OP) is entering a decisive phase as traders closely monitor a key support zone between $0.506 and $0.460. While the token has shown temporary signs of recovery, the broader trend remains uncertain without confirmation from technical indicators.
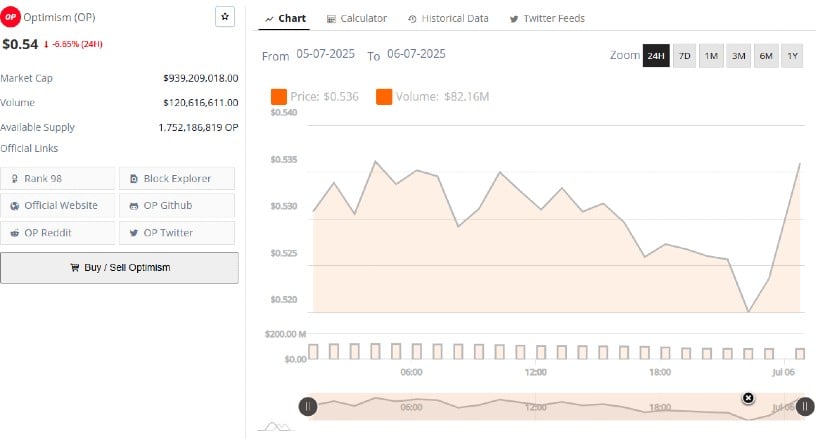
Analysts are focusing on the $0.573 resistance level as a crucial pivot that could define OP’s short- to medium-term trajectory. As of July 6, 2025, OP is trading near $0.530, with bulls and bears battling for dominance within a narrowing volatility range.
Price Range Narrows as Market Awaits Breakout Trigger
The past 24 hours have seen OP oscillate within a tight band between $0.520 and $0.535. After beginning the session near $0.530, the token experienced several brief spikes and pullbacks, suggesting reactive trading behavior rather than sustained directional movement.
A late-session rebound helped push the price to a high of $0.536 before closing the day slightly lower. This pattern highlights increased sensitivity around the current price zone, with traders cautious ahead of any significant breakout.
Source: BraveNewCoin
Despite the rebound, market sentiment remains subdued. Trading volume reached $120.6 million, showing moderate activity, especially during the late-day bounce. The market capitalization dropped to approximately $939 million, reflecting a 6.65% decline over the 24-hour period.
The volume uptick during the price recovery signals potential interest from buyers, although the overall structure suggests hesitation. The current range between $0.525 and $0.535 could act as a short-term consolidation area ahead of the next directional move.
Finora AI Highlights Critical Support and Resistance Zones
According to a recent chart shared by Finora AI, the $0.506–$0.460 region represents a major support zone for OP. The analysis suggests that this area is historically associated with liquidity pockets, often used by institutional players or algorithms to trigger stop-losses and gather orders.
If price action shows bullish signals—such as a bullish engulfing candle or a pin bar—within this range, it could validate a long-entry setup. The initial resistance lies at $0.573, with further targets at $0.626 and $0.689 if the recovery gains traction.

Source: X
The daily structure reveals that OP remains in a broader descending trend, dating back to its breakdown from above $3.00 earlier in the year. Attempts to climb above $0.60 have failed to hold, reinforcing the presence of a supply zone near that level.
Finora AI notes that a daily close above $0.573, followed by successful retests, would confirm a shift in market direction. On the other hand, any close below $0.460 would invalidate the current bullish setup, opening the door to potential declines toward $0.420.
Momentum Indicators Remain Weak as Price Hovers Near Bollinger Support
The daily chart of OP/USDT on TradingView shows the token consolidating near the lower boundary of its Bollinger Bands. The price closed at $0.530 after ranging between $0.519 and $0.539, remaining below the midline at $0.548. This positioning indicates that bearish momentum still holds influence, especially given the narrowing of the Bollinger Bands, which typically precedes a breakout.

Source: TradingView
The Awesome Oscillator (AO) currently reads -0.035, with recent histogram bars turning red after a brief green phase. This shift suggests that bearish momentum may be returning after a temporary pause.
A confirmed break above $0.548, paired with increasing volume, could validate bullish strength and potentially push OP toward the $0.60 mark. However, failure to hold above the $0.495–$0.50 support zone may expose the token to further downside pressure toward $0.47.