


![]()
![]()
![]()
![]()
![]()
![]()
![]()
The price of Optimism (OP) has come under renewed bearish pressure, slipping sharply below key short-term support zones and reaffirming a downward trend that has been in place since early 2024.
As of the latest trading session, OP/USDT has dropped to around $0.63, testing the strength of remaining buyers near a psychologically important level. Despite long-term interest in the Optimism ecosystem, current price action continues to show technical weakness and limited momentum from bulls.
Daily Chart Signals Renewed Bearish Momentum
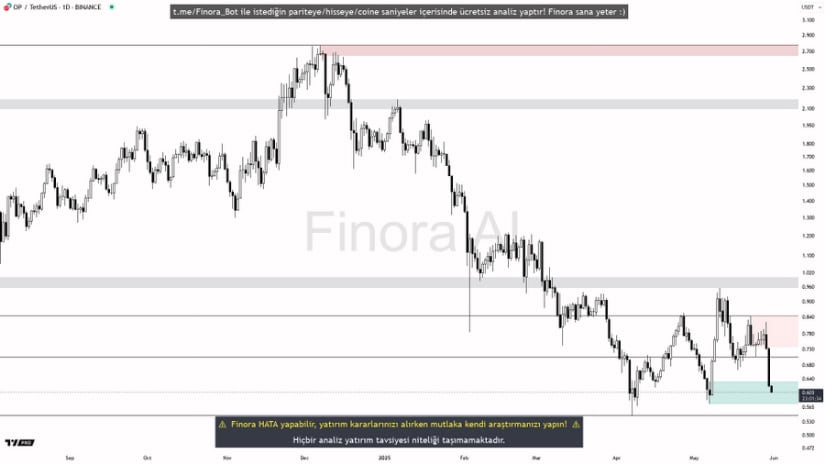
In a recent X post, Finora AI shared a bearish outlook for OP/USDT, highlighting the $0.573 level as a potential wick zone or base for temporary stabilization. The forecast aligns with ongoing price action, where optimism price prediction has consistently printed lower highs and lower lows.
The most recent breakdown below the $0.688 resistance zone marked a critical shift in control, confirming the failure of bulls to reclaim short-term dominance. At the time of analysis, the price hovered near $0.645, reflecting continued pressure and a lack of upward follow-through.
Source:X
The daily structure reinforces Finora AI’s bearish continuation scenario, with the range between $0.688 and $0.638 acting as a persistent rejection zone. Each recovery attempt into this band has been met with renewed selling, suggesting that short positions continue to enter on retracements.
Below current price levels, the analyst points to a light blue demand zone just above $0.573 as the last significant support before the next downside target near $0.480. This lower area also coincides with a visible volume gap on the left of the chart, indicating limited historical trading activity and a higher likelihood of accelerated price movement if breached.
Optimism Price Prediction:Volume Spikes Confirm Bearish Activity
Brave New Coin reported that OP/USDT experienced a 9% 24-hour drop, falling from around $0.68 to a low of $0.60. This movement was accompanied by a notable increase in volume, which peaked at over $309 million during the decline.
Such a rise in volume during a sharp price decrease suggests strong bearish participation, potentially from large sellers or panic-driven retail exits. The price attempted a modest rebound toward the end of the session, reaching near $0.64, but this recovery lacked the strength to break back into the previous support zone.

Source:Brave New Coin
The intraday chart also shows a descending structure, with lower highs and lower lows throughout the May 30 session. Selling intensified during the afternoon hours, aligning with broader risk-off sentiment in the crypto market.
Resistance near $0.64 remained unbroken, and the failure to recapture this level leaves OP vulnerable to further downside. Volume distribution beneath the price action shows that the bulk of trading occurred during the sell-off phase, reinforcing the idea that the move was driven by active exit strategies rather than accumulation.
Finora AI emphasized the need for patience before reentering long positions, advising technical traders to monitor for reversal patterns such as bullish engulfing candles or hammer formations on the 1-hour and 4-hour charts. Additionally, any bullish divergence on RSI at the $0.573 zone could indicate early signs of buyer interest, though confirmation through price action would be necessary before considering trend reversal scenarios.
Weekly Indicators Support Bearish Continuation
The broader trend remains unfavorable, as highlighted in the weekly OP/USDT chart. Since reaching a high of $2.77 in early 2024, OP has followed a clear descending pattern, and the latest weekly candle reflects a 15.82% decline, bringing the price to approximately $0.628. This consistent pattern of lower highs and lower lows indicates a dominant bearish trend with no technical reversal currently in sight.

Source:TradingView
From an indicator standpoint, the Chaikin Money Flow (CMF) reads at -0.14, confirming continued capital outflows. A CMF below zero is generally viewed as a sign of weak institutional interest and a market dominated by sellers.
This reading has remained negative since March, signaling that any bullish rallies have been met with selling pressure. For sentiment to shift, CMF would need to cross into positive territory, supported by increasing volume and sustained price recovery.
The MACD (Moving Average Convergence Divergence) further reinforces the bearish case. The MACD line at -0.267 remains below the signal line at -0.278, while the histogram has only just turned slightly positive at 0.011. This subtle bullish divergence lacks volume support and does not yet indicate a confirmed crossover. Without a meaningful shift in momentum indicators, OP remains technically positioned for additional downside risk, especially if the $0.60–$0.573 zone does not hold.
Outlook: Optimism Price Prediction Stays Bearish Below $0.688
The current outlook for Optimism remains bearish as long as price continues to trade below the $0.688 resistance threshold. Short-term recovery attempts have failed to break this ceiling, and sellers appear to be reinforcing control each time price approaches the $0.638–$0.688 band. The key support to monitor is the $0.573 level, which could serve as a potential bounce zone. If this level fails, OP may decline rapidly toward $0.480 due to limited historical volume in that range.
While Optimism’s role in Ethereum Layer 2 scaling through the OP Stack and Superchain architecture remains a long-term value driver, near-term price movement is heavily influenced by technical factors and market sentiment. Until reversal signals appear on shorter timeframes and volume begins to shift in favor of buyers, the prevailing trend suggests further weakness in the sessions ahead.