


![]()
![]()
![]()
![]()
![]()
![]()
![]()
After several days of sustained selling pressure, Optimism (OP) has begun to exhibit signs of potential recovery.
The token’s price action across multiple timeframes shows that the recent consolidation phase may be stabilizing, with minor bullish structure forming.
Market participants appear to be cautiously re-entering, supported by rising intraday volume and steady open interest levels. While OP remains far below its historical highs, the latest developments point to a possible short-term continuation if key resistance levels are tested and maintained.
Market Activity Shows Emerging Strength Near Local Support
The hourly chart for OP/USD Price Prediction highlights a persistent bearish trend that started around June 11, leading to a sharp decline from approximately $0.76 to a low near $0.55. This significant drop was marked by consistent red candles and brief, unsuccessful bounce attempts, underscoring seller dominance throughout this period. The rapid descent was further supported by high sell volume and the absence of strong buying momentum.
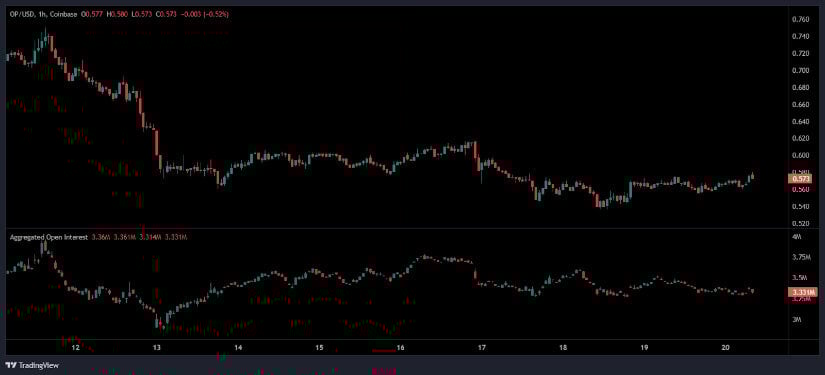
Source: Open Interest
As the price neared the $0.55 support zone, it transitioned into a sideways movement between $0.55 and $0.58. This consolidation suggests a potential accumulation zone or a state of market indecision. Despite small breakouts above $0.58, the price failed to sustain momentum, reflecting persistent resistance near the $0.58 to $0.60 range. The chart structure indicates a tug-of-war between buyers and sellers, with neither side yet establishing clear control.
Open Interest data adds additional context to this phase. A sharp decline in open interest paralleled the price drop, pointing to widespread liquidation or the closure of long positions. During the consolidation, open interest stabilized near 3.3 million, with no significant rise during minor rallies.
This implies that traders are hesitant to commit new capital until a clearer breakout is confirmed. The flat open interest trend supports the view that the market remains cautious as it awaits directional confirmation.
Optimism Price Prediction: Volume Uptick and Price Behavior Support Short-Term Rally Prospects
Additionally, the 24-hour chart from June 19 to June 20 illustrates a recovery in Optimism’s price Prediction from a low below $0.555 back toward the $0.573 level. The movement occurred gradually, with the formation of higher lows and highs throughout the session. A key acceleration phase was observed in the final hours, where both price and volume spiked, signaling renewed buyer interest and a possible continuation of bullish momentum.
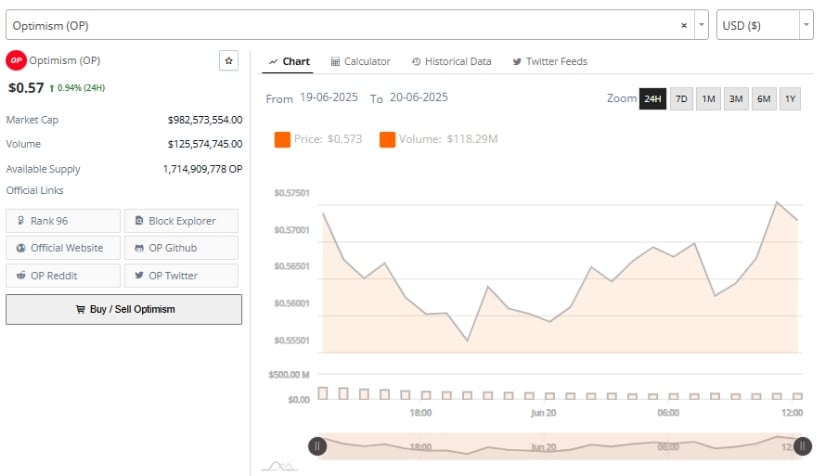
Source: Brave New Coin
Volume surged to $125.57 million over the 24 hours, marking a significant increase in trading activity relative to the asset’s market capitalization of approximately $982.57 million. This volume was concentrated around the late-session rally, suggesting active participation from both retail and institutional participants. The average price during this period held above $0.56, indicating that the local support level may be firming as a base for potential upward movement.
On-chain figures reflect Optimism’s circulating supply at 1.714 billion tokens. The daily price change remained modest at 0.94%, but when paired with volume expansion and structure formation, this movement suggests that OP is entering a phase of early recovery. The short-term outlook could improve further if the token breaks above the $0.575–$0.580 resistance zone and establishes this level as support in upcoming sessions.
Technical Indicators Suggest Cautious Recovery in Broader Context
On the other hand, the weekly timeframe, OP Price Prediction continues to trade deep within a longer-term downtrend, having lost approximately 88% of its value from the 2023 peak at $4.87. The current price of $0.573 reflects a prolonged correction that has yet to show definitive signs of reversal. However, the most recent weekly candles suggest that price movement has narrowed, pointing to a potential pause in the prevailing bearish trend.

Source: TradingView
The Relative Strength Index (RSI) on the weekly chart stands at 35.46, placing it just above the oversold threshold. This value indicates that bearish momentum may be slowing. Earlier bearish divergence patterns had reinforced downward pressure, but the current flattening of the RSI suggests that sellers may be losing control, even if no upward breakout has yet materialized.
The Moving Average Convergence Divergence (MACD) indicator presents early signs of a shift in trend. While still in negative territory, the MACD line is approaching the signal line, and the histogram has turned slightly positive with a reading of 0.015.
If the MACD crosses above the signal line in the coming sessions, it could indicate a change in momentum. For the broader recovery to take hold, however, OP will need to reclaim levels above $1.00, which remains a key technical and psychological threshold.
Overall, Optimism’s recent price behavior suggests that the token may be preparing for a short-term rebound. With rising intraday volume, stabilizing technical indicators, and cautious but growing market participation, conditions are forming that could support a potential recovery if sustained buying continues above key resistance zones.