


![]()
![]()
![]()
![]()
![]()
![]()
![]()
Polkadot
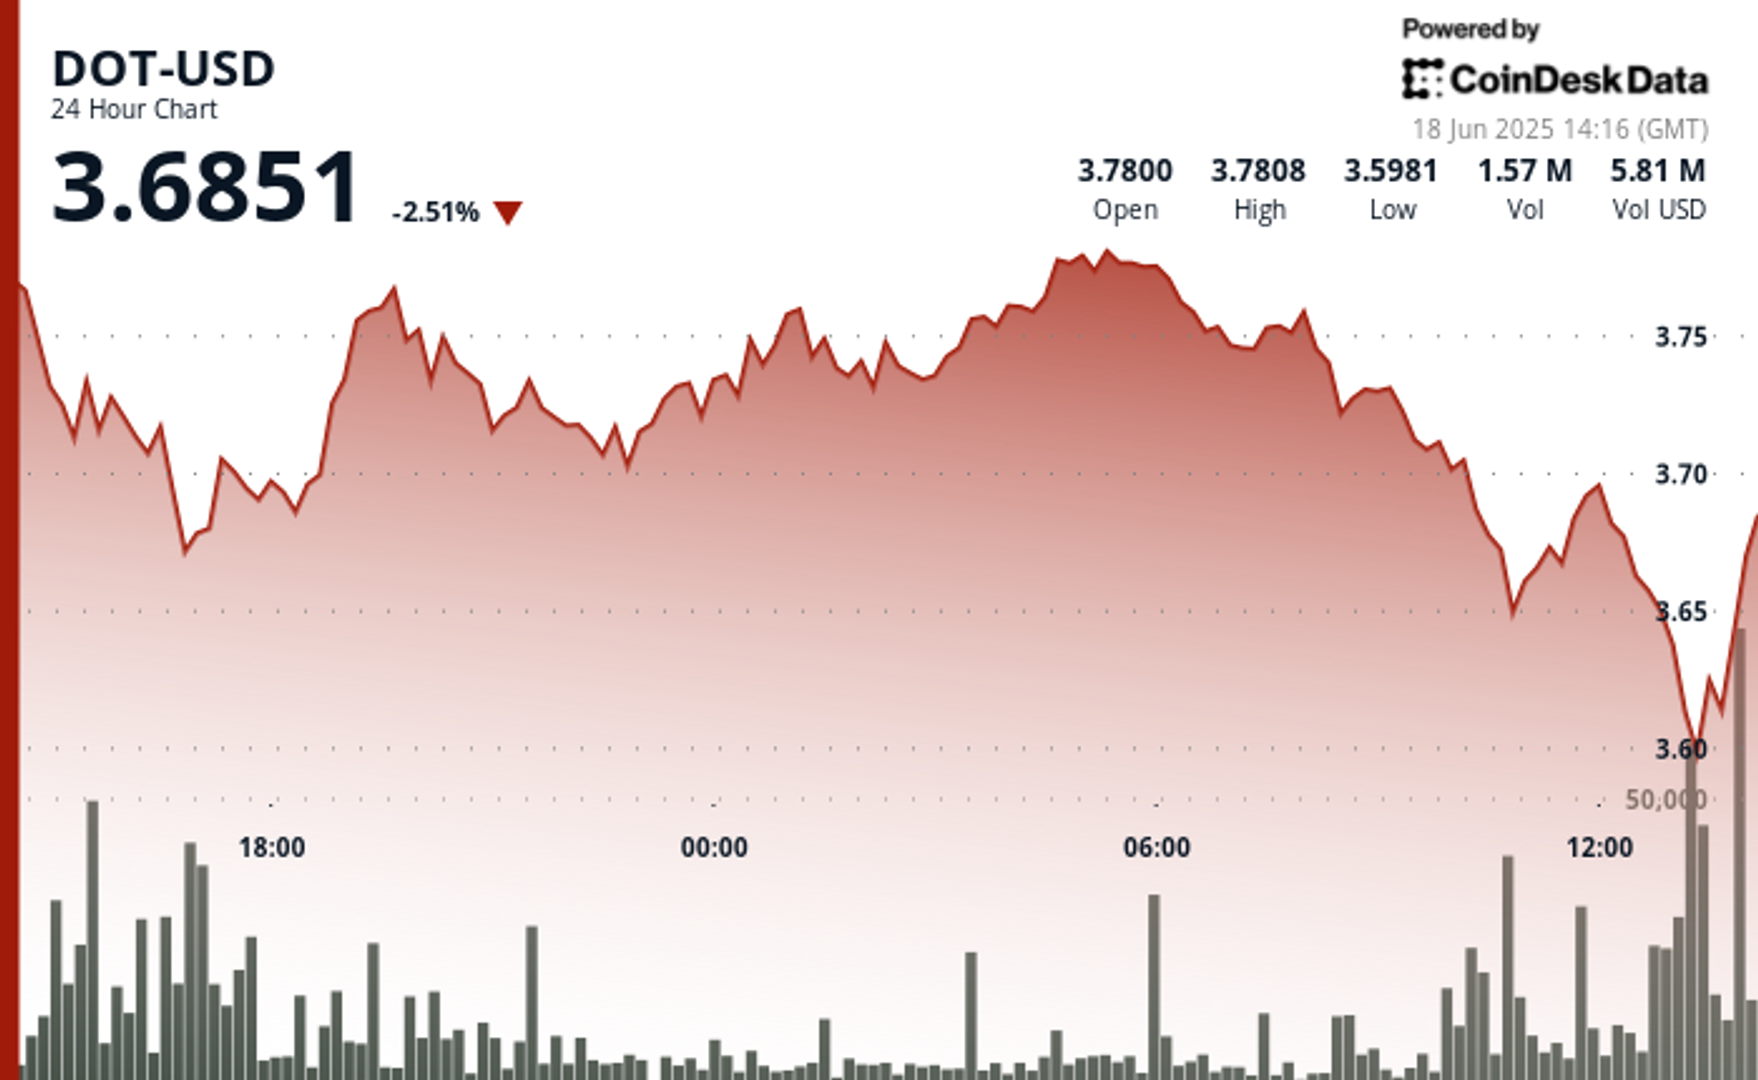
encountered substantial selling pressure, dropping as much as 5% before rebounding and potentially forming a double bottom pattern that points to continued upward movement, according to CoinDesk Research’s technical analysis model.
After initially attempting to establish an uptrend with a peak at $3.787, DOT encountered strong resistance and formed a bearish reversal pattern, according to the model.
In recent trading, DOT was 2.6% lower over 24 hours, trading around $3.63 having found support at $3.59. The broader market gauge, the CoinDesk 20, was down 0.5% at publication time.
The price action shows a potential double bottom pattern forming with improving momentum, suggesting further upside if it maintains support above the $3.62 price level, the model showed.
Technical Analysis:
- DOT experienced a volatile 24-hour period with a substantial range of 0.193 (5.1%), initially attempting to establish an uptrend with a peak at $3.787 before encountering strong resistance.
- The price action formed a bearish reversal pattern as DOT failed to hold above the $3.75 level, followed by accelerated selling on high volume during the 10:00 and 13:00 hours when volume spiked to nearly 4 million units — well above the 24-hour average.
- Support emerged at $3.594, though the current price structure suggests further downside risk as DOT closed near session lows with weakening momentum indicators.
- In the last hour, DOT experienced significant volatility with a sharp decline from $3.643 to a low of $3.594, followed by a recovery attempt.
- The price found strong support at the $3.594 level, triggering a V-shaped recovery that pushed DOT up by 1.3% to $3.642.
- The recent price action forms a potential double bottom pattern with improving momentum, suggesting the possibility of continued upward movement if DOT can maintain support above the $3.62 level.
Disclaimer: Parts of this article were generated with the assistance from AI tools and reviewed by our editorial team to ensure accuracy and adherence to our standards. For more information, see CoinDesk’s full AI Policy.