


![]()
![]()
![]()
![]()
![]()
![]()
![]()
This is a daily technical analysis by CoinDesk analyst and Chartered Market Technician Omkar Godbole.
A key indicator suggests that bitcoin’s
price could soon become more volatile, possibly leading to the next leg higher in the cryptocurrency.
This indicator is based on the gap between the bollinger bands, which are volatility bands placed two standard deviations above and below the 20-week simple moving average of the cryptocurrency’s price.
When the gap widens, it indicates that the market is more active and volatile – a phenomenon historically observed ahead of significant upward moves in BTC. When the gap narrows, it indicates less activity.
The gap, also known as the bollinger band spread, could soon widen in a positive sign for the bulls, as the MACD histogram linked to the same gap has turned positive.
Using the spread between the bollinger bands as input in the MACD histogram generates bullish or bearish volatility signals, identifying periods of turbulence and calm. Traders typically use the indicator to detect trend reversals in prices.
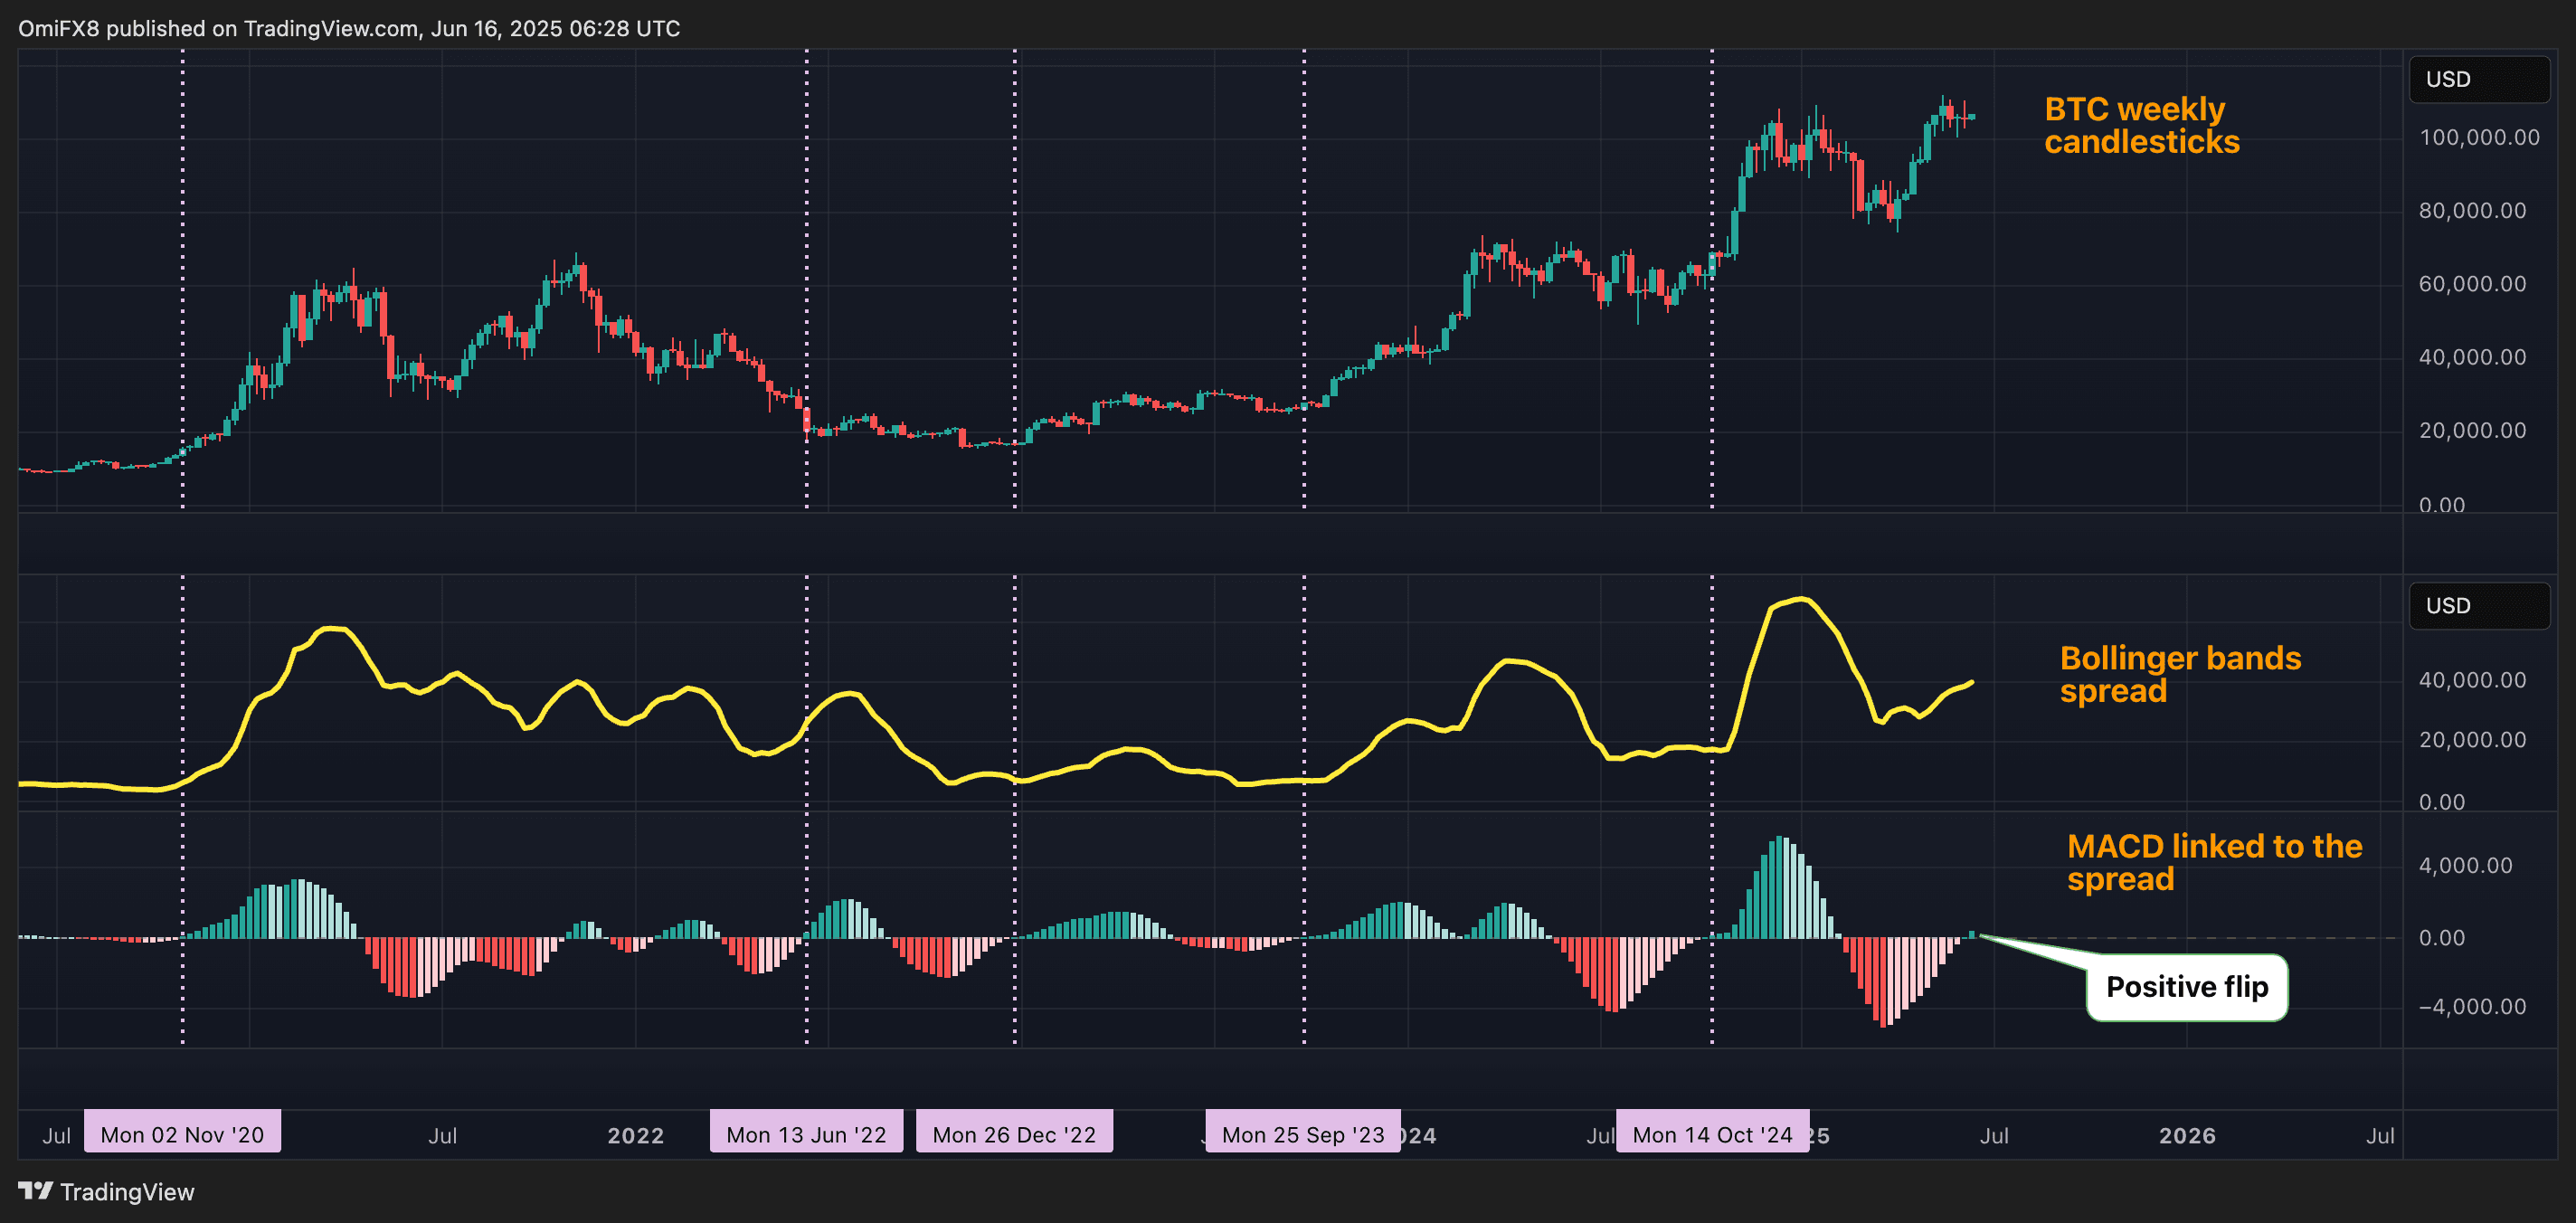
The upper pane displays bitcoin’s weekly open, high, low, and close (per UTC) in candlestick format. The middle pane displays the spread, or the gap between the bollinger bands, with the MACD linked to the spread in the lower pane.
The MACD has now flipped positive, indicating a renewed widening of the spread or volatility boom ahead. By default, volatility is price-agnostic, meaning an impending activity could be bullish or bearish.
That said, a closer look at the above chart reveals that previous positive crossovers of the MACD (marked by vertical lines) presaged major bull runs, including the late 2020 and late 2024 price rallies.
Let’s see if history repeats itself.