

![]()
![]()
![]()
![]()
![]()
![]()
![]()
Sei (SEI) is showing signs of building momentum as traders monitor a tightening range that could precede a larger breakout. On both short- and long-term charts, the asset appears to be forming bullish structures supported by volume strength and a rising base of support.
Current technical patterns suggest a breakout above key levels may lead to a notable upside in the coming sessions. At the time of writing, SEI is trading near $0.2672.
Compression Structure Builds Toward Breakout Target
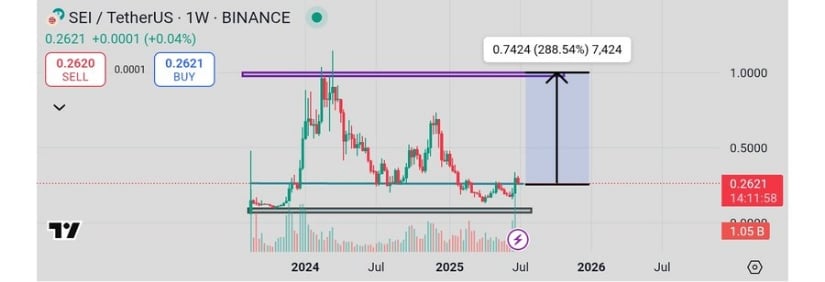
A technical analysis shared by @CryptoGem10xx highlights SEI’s behavior on the weekly timeframe, where the token has been consolidating above long-standing support. Price action suggests the asset is approaching a pivotal resistance near the $0.28 zone, which could trigger a larger breakout if reclaimed.
The chart points to a projected 288% rally with a longer-term target of $1.00. Supporting this forecast are growing volume levels and bullish momentum signals as the token continues to respect the rising base.
Source: X
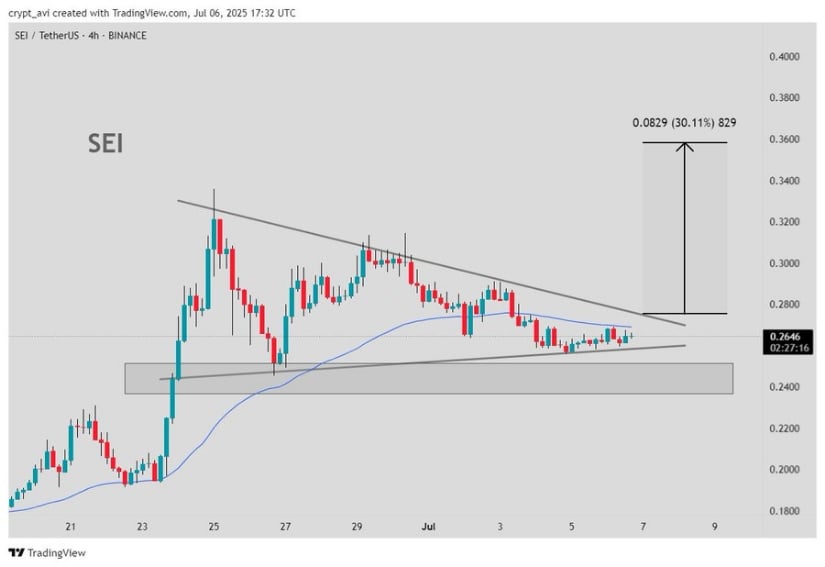
Meanwhile, analyst @crypt_avi examined the 4-hour chart, where SEI is currently confined within a descending triangle pattern. The price is compressing between a downtrend line and the support band around $0.245–$0.250. This narrowing range is a typical setup ahead of breakouts.
If SEI can clear the resistance near $0.28, Avi estimates a short-term price target of $0.3475, indicating a potential 30% gain. Increasing rejection wicks at lower levels show signs of buying interest, reinforcing the potential for an upside move once the triangle breaks.
Source: X
The alignment of both the weekly and short-term charts offers a consistent technical narrative. Reclaiming the $0.28 level may serve as a key trigger for both medium- and long-term upside.
While the lower timeframe breakout offers a shorter-term target, the weekly projection points to a more extended move, particularly if market conditions support continued buying pressure. Traders are watching both zones closely as SEI tightens within this high-probability range.
Volume Activity and Intraday Patterns Reflect Market Interest
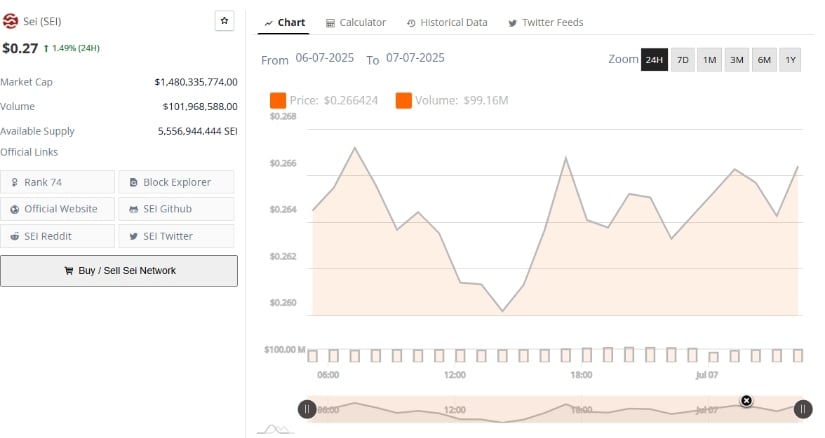
Based on data over the last 24 hours, SEI’s price held firm above $0.26, reflecting a modest gain of 1.49%. Price ranged between $0.260 and $0.266 during this period, showing signs of controlled upward movement with limited pullbacks. Volume reached $101.9 million, with spikes observed during short bursts of buying activity.
These volume surges often coincided with price moves, hinting at underlying accumulation. This behavior suggests that traders may be preparing for a breakout attempt if SEI breaches nearby resistance.
Source: BraveNewCoin
Market capitalization currently stands at approximately $1.48 billion. The asset maintains a large circulating supply exceeding 5.5 billion tokens, which contributes to its high liquidity and price responsiveness. SEI’s resilience above $0.26 is notable, as the zone has consistently acted as a base during intraday pullbacks.
Technical setups also show an emerging W-shaped structure on the lower timeframes. If buyers continue to protect the $0.264–$0.266 support area, a push toward $0.268 and beyond could materialize, particularly with volume strength.
Momentum Indicators Show Mixed Readings Amid Consolidation
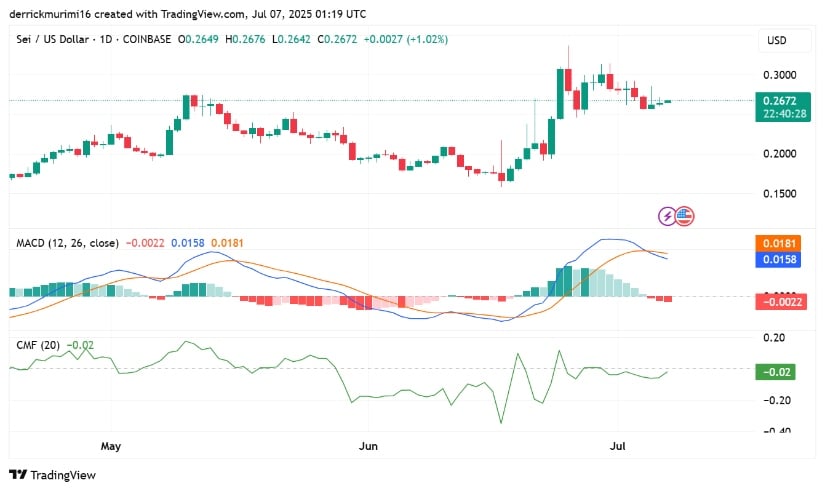
Additionally, SEI’s daily chart reflects a short-term consolidation phase, with the price holding at $0.2672 after rallying from levels below $0.20. This movement established a range between $0.264 and $0.30, where traders now await further direction.
The current candle displays a narrow body and tight price range, suggesting a pause in volatility. Despite this, the asset remains supported above $0.26, reflecting steady interest from buyers seeking confirmation of the next trend.
Source: TradingView
Momentum indicators show diverging signals. The MACD has recently flipped bearish, with its line crossing below the signal line and red histogram bars appearing. However, both lines remain above the zero mark, keeping the broader trend in neutral to bullish territory.
Meanwhile, the Chaikin Money Flow indicator reads -0.02, signaling low capital inflow. A breakout above $0.30 would likely require a renewed MACD crossover and CMF strength. Without these, SEI may continue to consolidate within its current range until stronger volume or sentiment drives a decisive move.