


![]()
![]()
![]()
![]()
![]()
![]()
![]()
Binance Coin (BNB) is inching closer to a pivotal moment, with its price structure narrowing beneath a key resistance zone. The asset has spent several sessions forming a tightly packed pattern, signaling that a major move could be on the horizon.
Market participants are watching closely as BNB hovers near the apex of a symmetrical triangle—an area that typically precedes significant price shifts. With volume steady and key support levels holding firm, all eyes are on the $686–$700 range as the gateway to higher targets.
Symmetrical Triangle Holds Price in Check as Breakout Pressure Builds
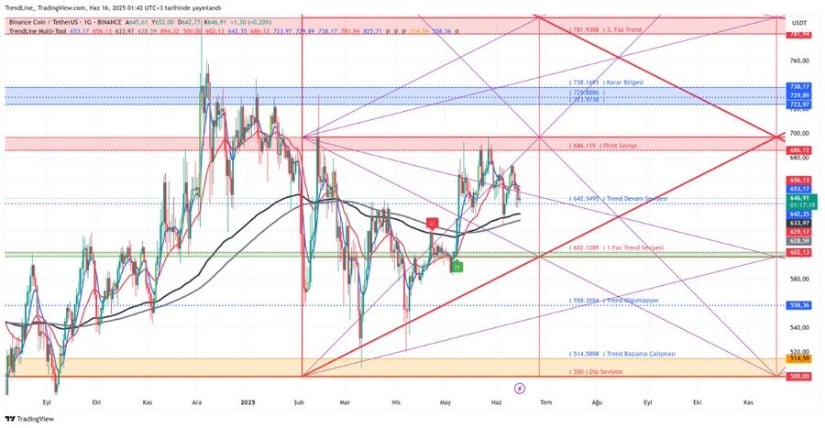
On a recent highlight, a detailed technical overview posted on X by TrendLine outlined the setup on BNB’s daily chart. The structure reveals a large symmetrical triangle pattern, placing BNB Price Prediction at a pressure point near $651. The price continues to compress within this formation, capped by resistance at $686. According to the technical roadmap, a confirmed breakout above this level could initiate a swift climb toward $700 and potentially extend toward a target at $781.
Source: X
Support levels are noted at $642–$635, with deeper structural backing around $602, referred to as the first major trend base. A breakdown below this area could trigger lower targets near $558 and $514. However, the triangle’s form, along with intersecting Fibonacci zones and aligned moving averages, continues to hint at an upward breakout scenario. The market’s current calm could be the buildup phase before a sharp directional move.
Volume Profile and Intraday Structure Signal Buyer Readiness
The 24-hour chart spanning June 16 to June 17 shows BNB trading in a stable range, with the price gradually climbing from under $655 to a peak near $660 before closing at $658.28. The modest daily gain of +0.42% suggests steady buyer activity rather than speculative spikes. This controlled movement points to a cautious accumulation phase as traders position around critical levels.

Source: Brave New Coin
Notably, trading volume surged to $730.27 million, with the bulk of activity—$718.84 million—occurring during upward price movements. These volume dynamics imply that recent gains were backed by genuine demand.
Mid-session dips were quickly absorbed by buyers, indicating underlying confidence. The asset’s ability to hold above $655 while building higher lows suggests preparation for a broader move. With a circulating supply of 145.88 million BNB and a total valuation of $96.04 billion, Binance Coin maintains its strength among top crypto assets.
Binance Coin Price Prediction: Weekly Indicators Suggest Momentum Is Rebuilding
On the weekly timeframe, Binance Coin Price Prediction holds its ground at $658.36, registering a +1.57% gain for the week. While not a major breakout, this movement fits within a broader trend of higher lows following BNB’s recovery from its 2022–2023 bottom near $183. The asset has remained above key long-term support levels and continues to form a stable base, giving bulls some structural advantage.

Source: TradingView
Momentum indicators are beginning to shift. The Chaikin Money Flow (CMF) has turned slightly positive at +0.03, signaling a slow return of capital into the asset. Though the reading is not yet strong enough to confirm aggressive accumulation, it reflects an improvement from recent weeks. A continued upward trend above +0.10 would suggest increasing confidence among larger players.
The MACD further supports a bullish narrative, as it shows a crossover with the MACD line at 10.12, overtaking the signal line at 5.93. The histogram reading of +4.19 provides additional confirmation of growing momentum. Historically, such crossovers on the weekly chart have led to extended rallies, particularly when volume trends align. Should BNB maintain its current trajectory, a move toward the $700–$750 range remains realistic, with a potential breakout toward $781 becoming increasingly viable if resistance fails to hold.