


![]()
![]()
![]()
![]()
![]()
![]()
![]()
This is a daily technical analysis by CoinDesk analyst and Chartered Market Technician Omkar Godbole.
The dollar index (DXY), which tracks the greenback’s value against major fiat currencies, looks south, having taken a beating in the first half. Still, bitcoin’s
chart points to immediate downside risks.

The DXY fell over 10% in the first half, its worst six-month performance since the third quarter of 1991, according to data source TradingView. U.S. President Donald Trump’s trade war and constant calls for Fed rate cuts supposedly weighed on the greenback.
The sharp slide has breached the 14-year-long ascending trendline, pushing the MACD histogram below zero on the half-yearly price chart.
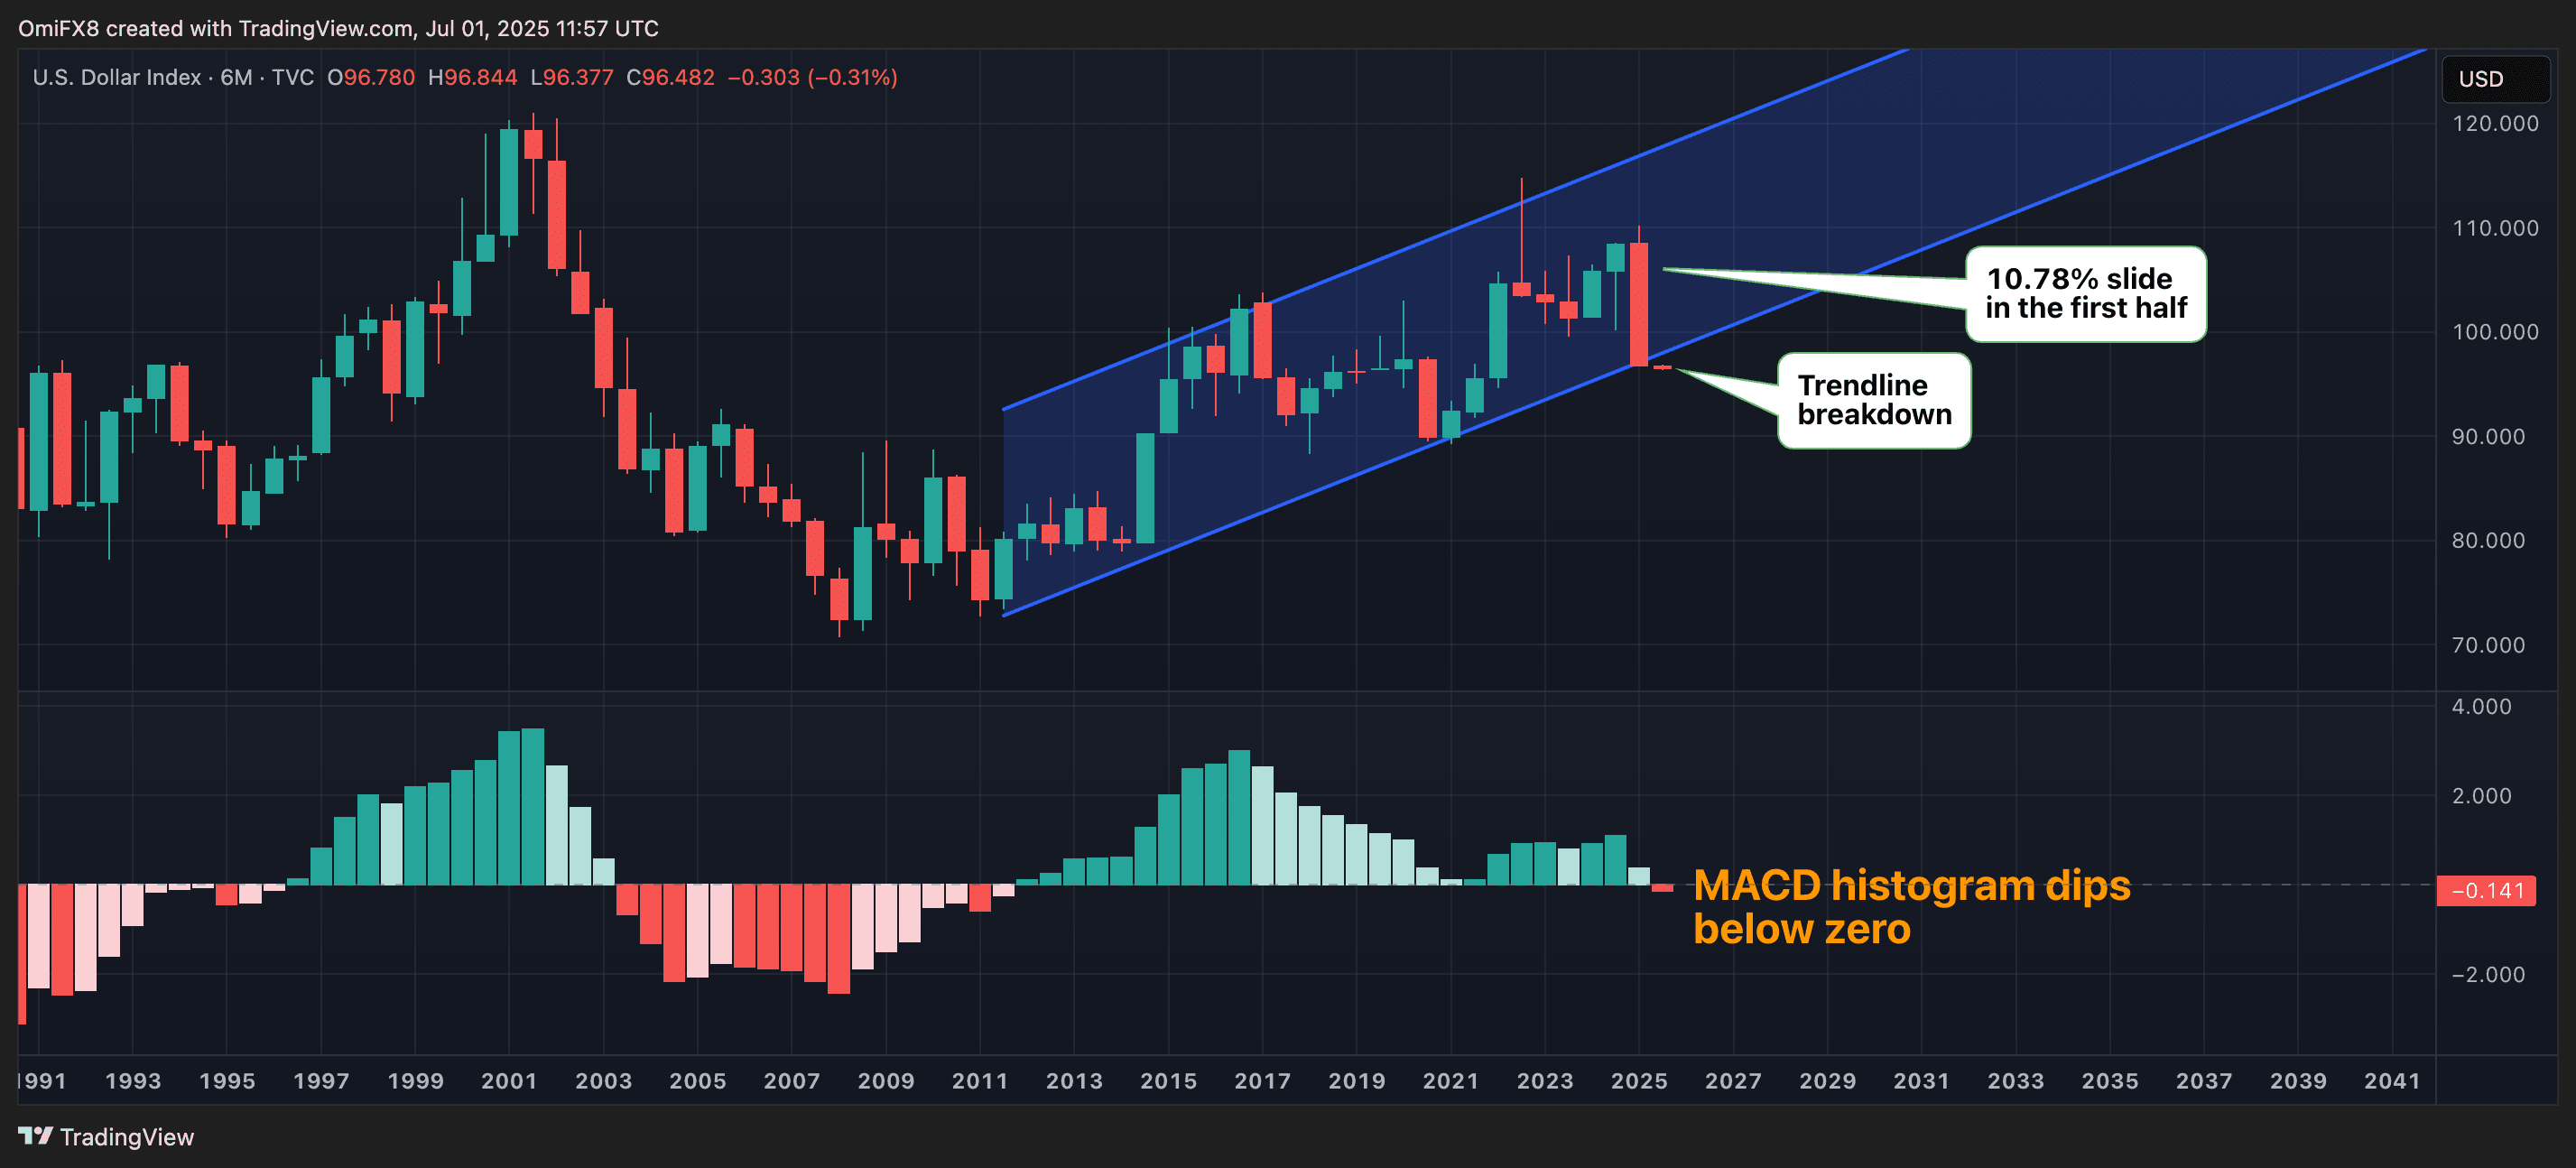
The trendline breakdown, coupled with the negative MACD, suggests a strengthening of bearish momentum and points to further losses ahead.
“Looks like USD could drop another 10% easily….and maybe a lot more in the next 12-24 months,” Dan Tapiero, founder and CEO of DTAP Capital, said on X, calling it a bullish tailwind for bitcoin.
BTC faces sell-off risks
Bitcoin’s short-term technicals, particularly the ongoing price action relative to the stochastic indicator, paint a bleak picture. BTC fell 1% on Monday, turning lower from the upper end of the bull flag countertrend consolidation carved out over the past six weeks.
In such conditions, traders typically use oscillators, such as the stochastic, to confirm whether the rejection at the upper boundary of the ongoing consolidation has set the stage for a renewed slide to the lower end.
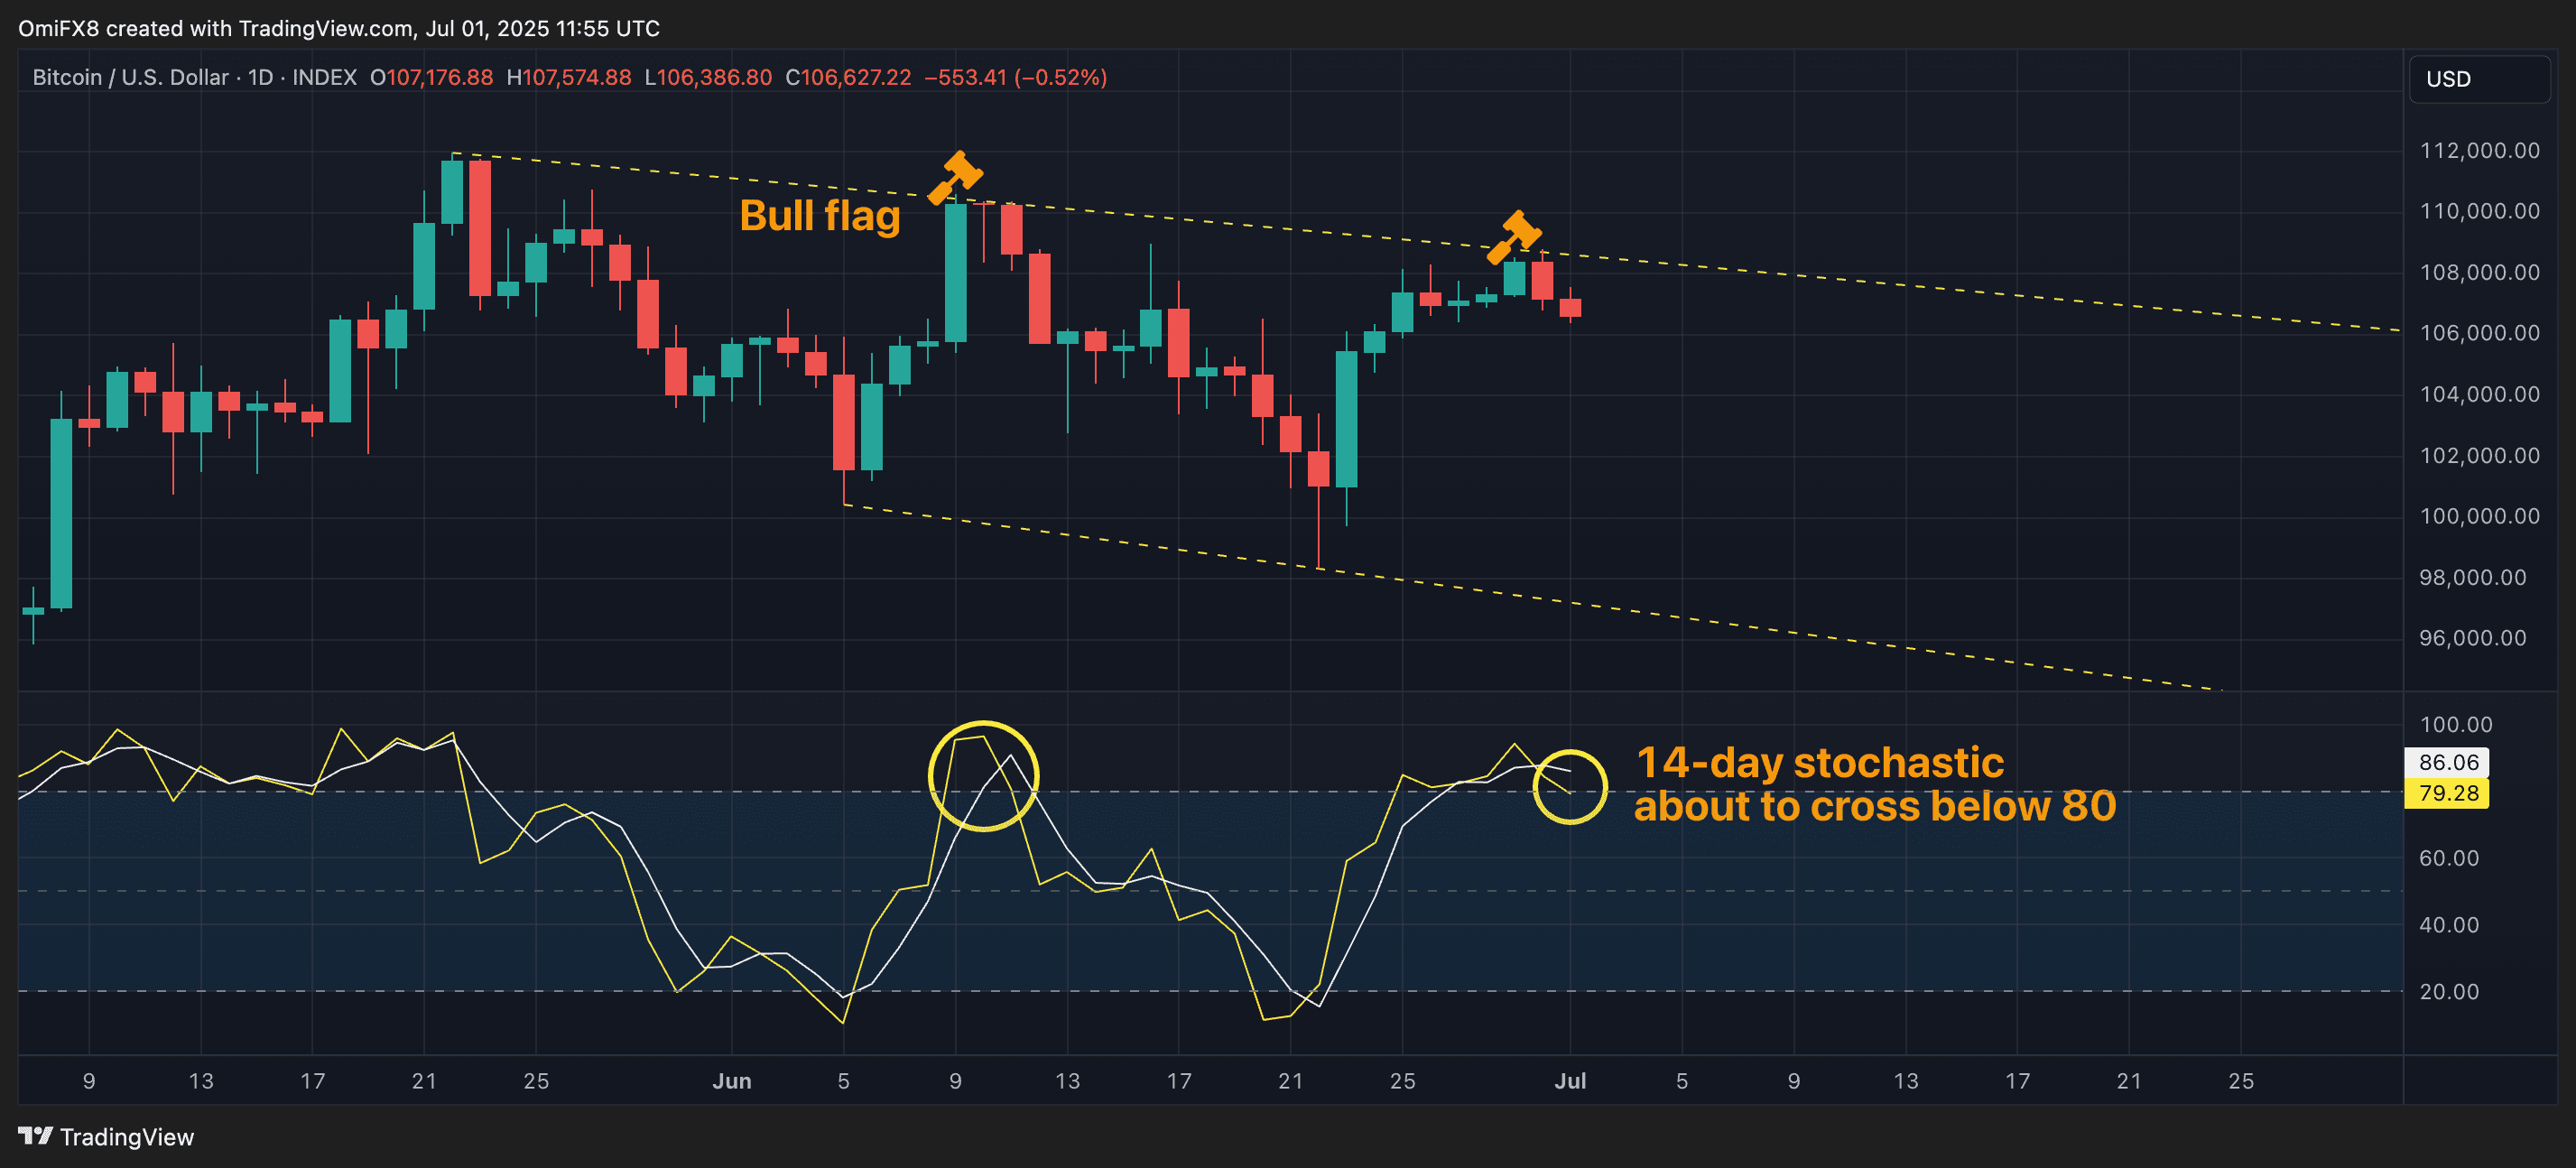
In BTC’s case, the 14-day stochastic confirms the same, repeating the pattern seen in the first half of June. The oscillator is on the verge of crossing below 80, marking a downturn from the overbought region to suggest renewed sell-off within the broad price range.
In other words, BTC could revisit sub-$100,000 in the short term. A firm move above the upper end of the consolidation will invalidate the bearish signal, setting the stage for a rally to $140,000.
Read more: Bitcoin’s Bull Case Strengthens as Dollar Index Slides, Nvidia Hits Record High Amid Recession Cues