

![]()
![]()
![]()
![]()
![]()
![]()
![]()
The setup is attracting attention across technical analysis circles due to its pattern reliability and defined risk boundaries. Market behavior in the coming days could determine whether this consolidation transitions into a significant rally.
Worldcoin (WLD) is currently trading at a critical inflection point, supported by the formation of a key technical structure. With price action compressing against horizontal resistance and the lower trendline holding firm, traders are closely monitoring WLD for a breakout confirmation.
Ascending Structure Signals Compressed Momentum
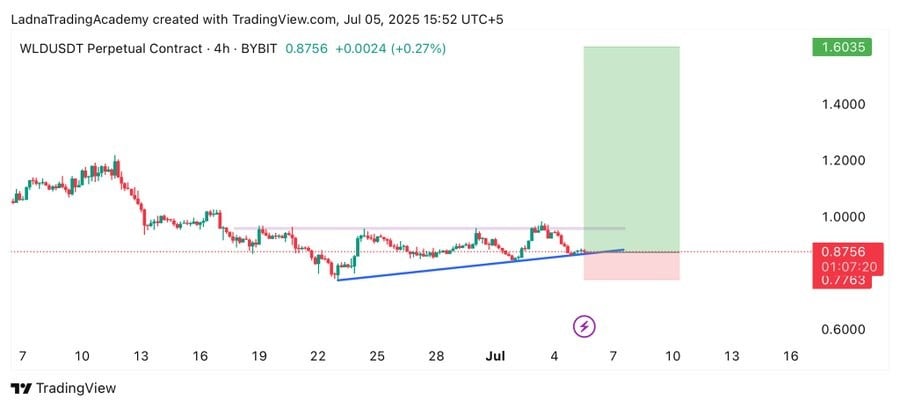
A recent post by analyst @JamesBitunix from USA Signal outlines an ascending triangle developing on the 4-hour WLD/USDT chart. This pattern reflects a series of higher lows pressing against a horizontal resistance between $0.95 and $1.00.
The price has tested this level multiple times without a confirmed breakout, suggesting that supply at this zone remains strong, but so does the demand supporting each dip. Most recently, WLD retested its ascending trendline support near $0.875, validating it as a key level for short-term buyers.
Source: X
Currently, the asset trades at $0.8756, sitting directly on this rising support zone. A successful defense of this level and breakout above the horizontal resistance could activate the measured move projection.
The pattern’s height suggests a potential upside toward $1.60, representing a target range if bullish volume accompanies the breakout. The invalidation of this pattern would occur with a daily close below $0.86, which could shift momentum back in favor of sellers.
Short-Term Pressure and Volatility Define Market Caution
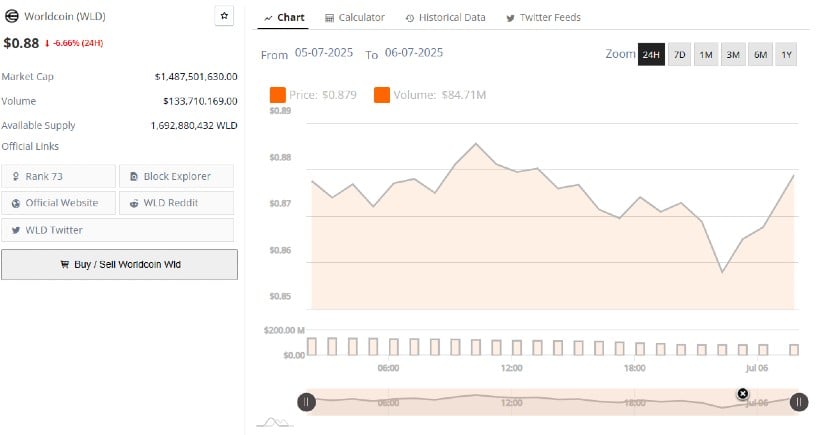
Recent 24-hour market data shows WLD experiencing a volatile session. The price briefly rose from $0.879 to $0.885 before retracing to a low near $0.863. This fluctuation was followed by a minor rebound to $0.88 by the end of the trading session. The movement indicates that sellers are active near resistance, while bulls continue to defend support, creating a narrow and reactive range.
Souce: BraveNewCoin
Daily volume for the session was recorded at $84.71 million, significantly lower than the cumulative 24-hour turnover of $133.71 million. This implies that much of the activity occurred earlier in the day, followed by reduced participation in the latter half. As volume declined, bearish momentum resumed, reflected in the late-session dip.
The market capitalization fell to $1.48 billion, underlining a cautious sentiment among participants. For any bullish continuation, WLD must break and hold above $0.89 with higher volume engagement.
Indicators Suggest Build-Up Toward Breakout
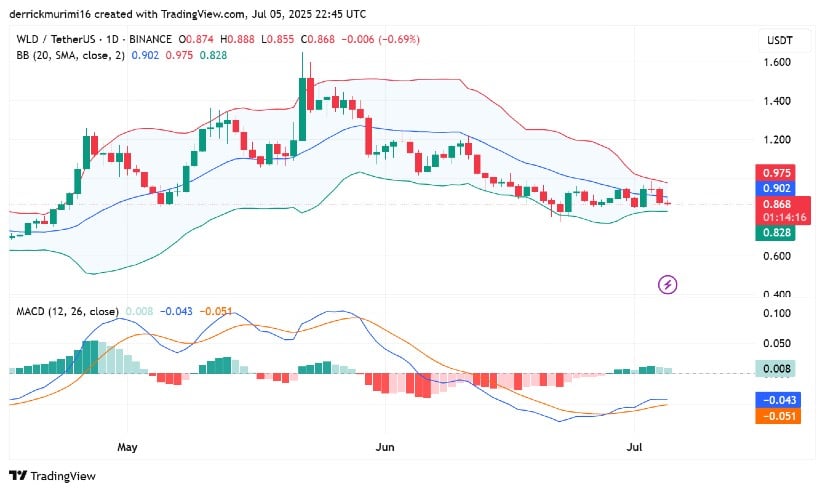
The daily chart for WLD/USDT shows price consolidating between $0.82 and $0.90, forming a tight trading band. Bollinger Bands have narrowed, with the upper band at $0.975 and the lower at $0.828, signaling declining volatility.
This kind of price compression typically precedes an expansion phase, making the next directional move critical. WLD currently trades at $0.868, just below the 20-day simple moving average of $0.902, a key resistance level that bulls need to reclaim for continuation.
Source: TradingView
The MACD indicator remains in bearish territory, with the MACD line at -0.043 still below the signal line. However, histogram bars are light green, pointing to slowing bearish momentum. A crossover may be on the horizon if momentum picks up.
For now, price action suggests that buyers are attempting to build a base, but confirmation is required through a decisive close above the midline of the Bollinger Bands. If price fails to break out, a move back toward the $0.828 support is likely. Traders remain focused on breakout signals from this compressed range to guide their next steps.