


![]()
![]()
![]()
![]()
![]()
![]()
![]()
This is a daily technical analysis by CoinDesk analyst and Chartered Market Technician Omkar Godbole.
There is an old saying, “Once is a chance, twice is a coincidence, and a third time is a trend.”
It applies to bitcoin
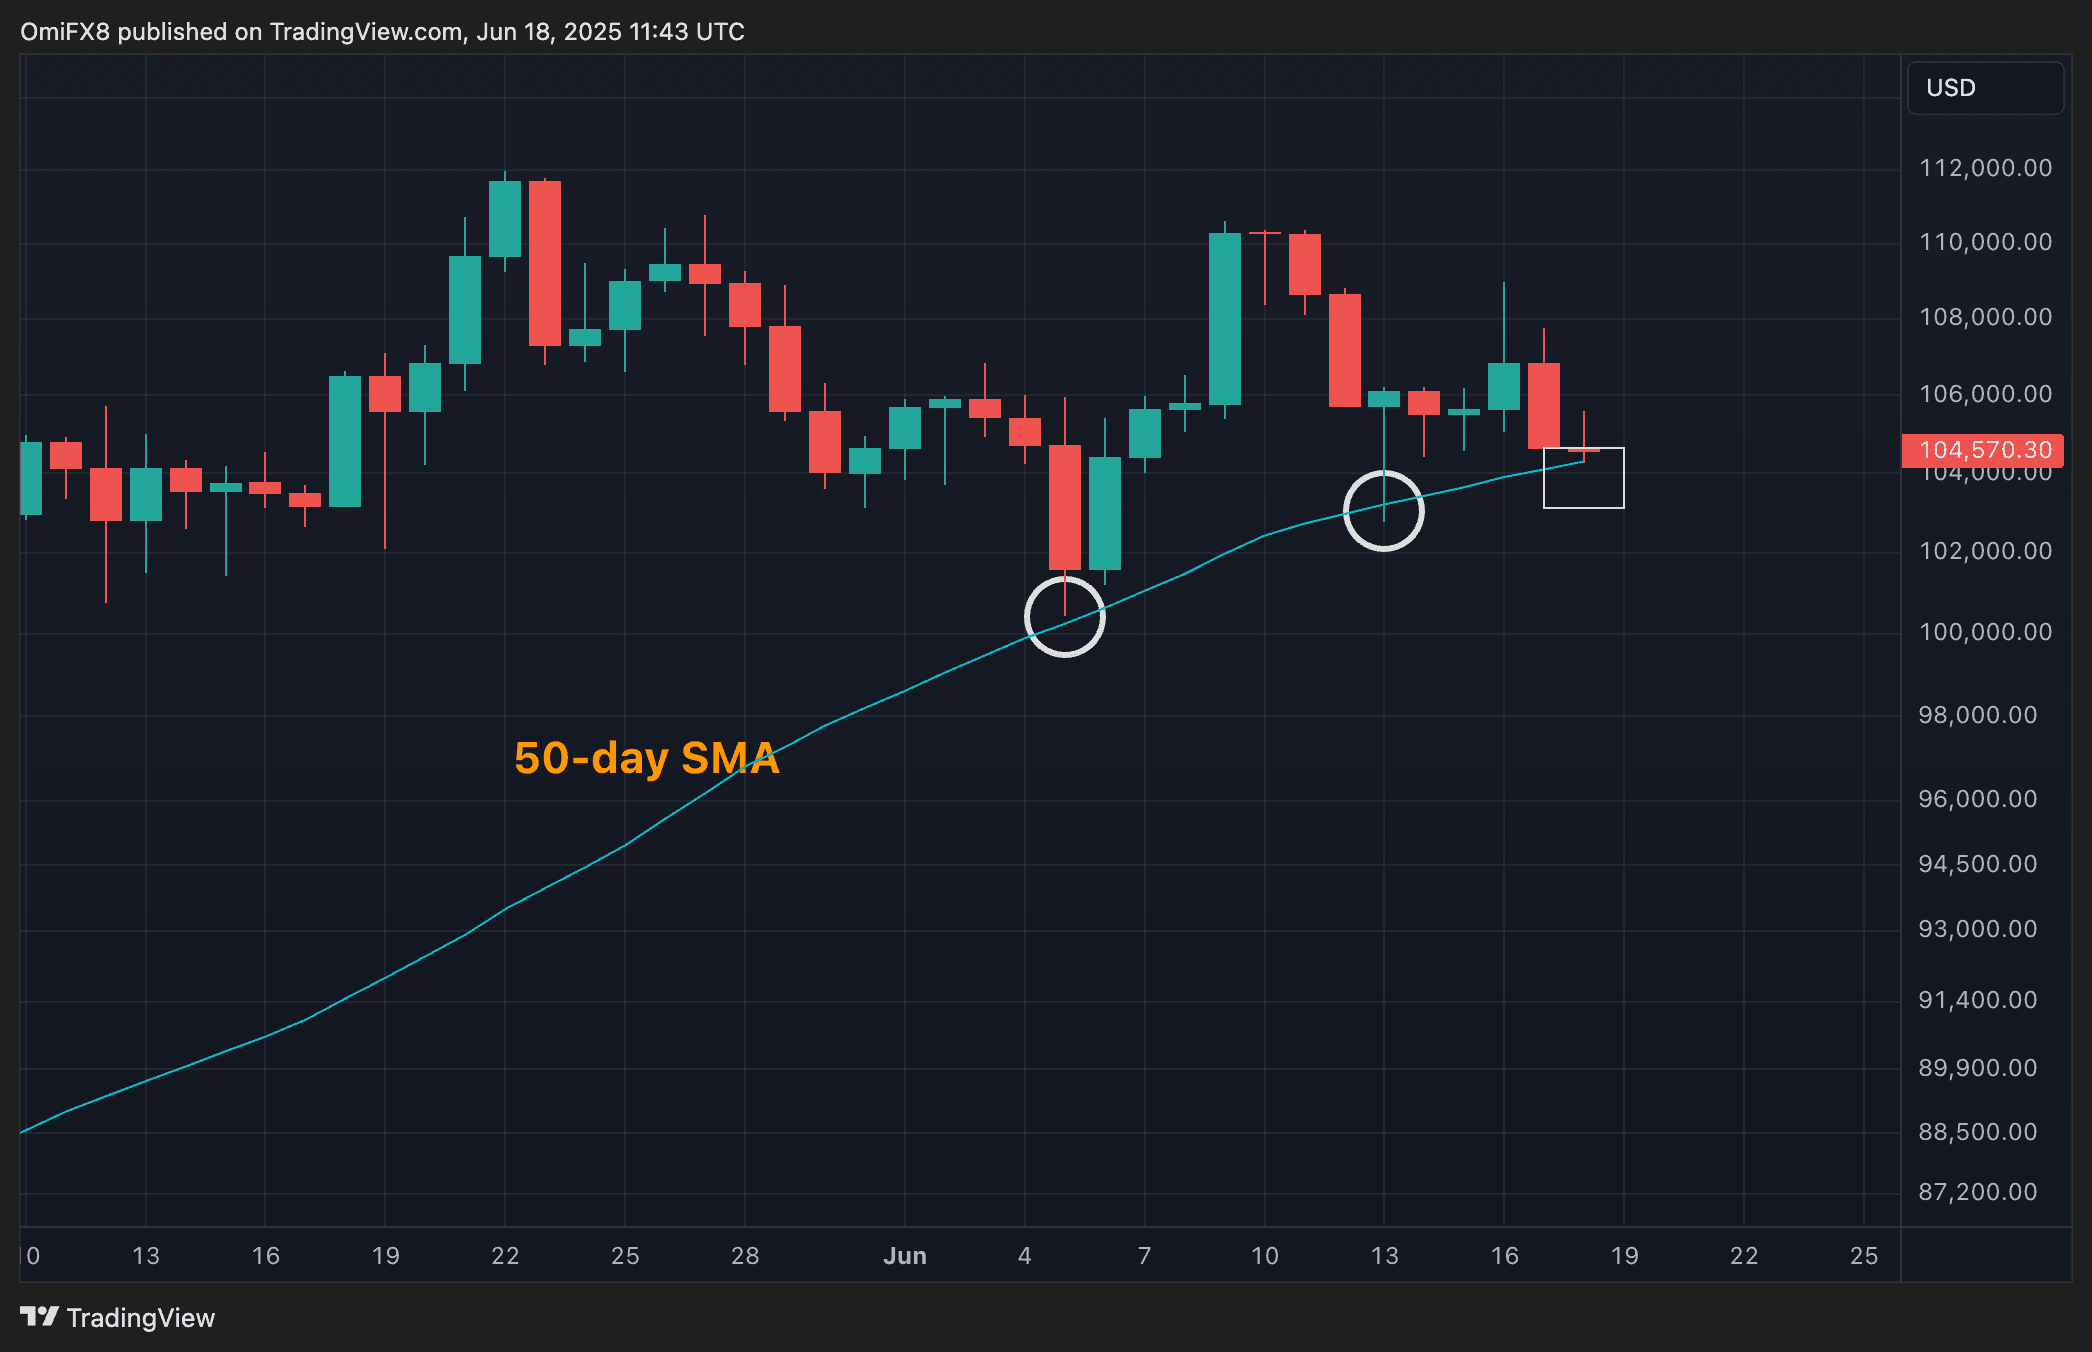
right now. The cryptocurrency’s price has fallen back to its 50-day simple moving average (SMA), which offered support on two occasions this month, leading to price bounces.
Therefore, the latest re-test of the average presents an opportunity for the bulls to establish a trend in which the 50-day SMA powers new legs higher. Conversely, the fall of the 50-day SMA support could invite stronger selling pressure, potentially leading to a dip below $100,000.
At press time, the bear case appears strong due to signs of bull fatigue, as evident from the recent shallow bounces from the 50-day SMA. The first test of the average on June 5 produced a bounce from roughly $100,500 to over $10,000. However, the second test of the SMA on June 17 saw prices bounce only from $103,000 to $109,000.
The past week’s Doji candle also suggests bull fatigue above $100,000.
A high-volume move above $110,000 is needed to restore the immediate bullish outlook.
XRP headed the DOGE way?
Payments-focused cryptocurrency XRP
is trading at the lower end of the Ichimoku cloud, a momentum indicator based on several moving average variants and developed by a Japanese journalist in the 1960s.
Crossovers above and below the cloud are said to represent bullish and bearish shifts in momentum.
When an asset’s price crosses below the cloud, as dogecoin
did early this month, it typically signals a bearish trend. Traders often interpret this as a signal to consider selling or shorting the asset, especially if other macro or technical indicators confirm the signal.
XRP’s 50-day SMA has already crossed below the 200-day SMA to confirm the so-called death cross, a bearish indicator. Therefore, a potential move below the Ichimoku cloud could prove costly for the bears, potentially opening the door for a slide below $2.
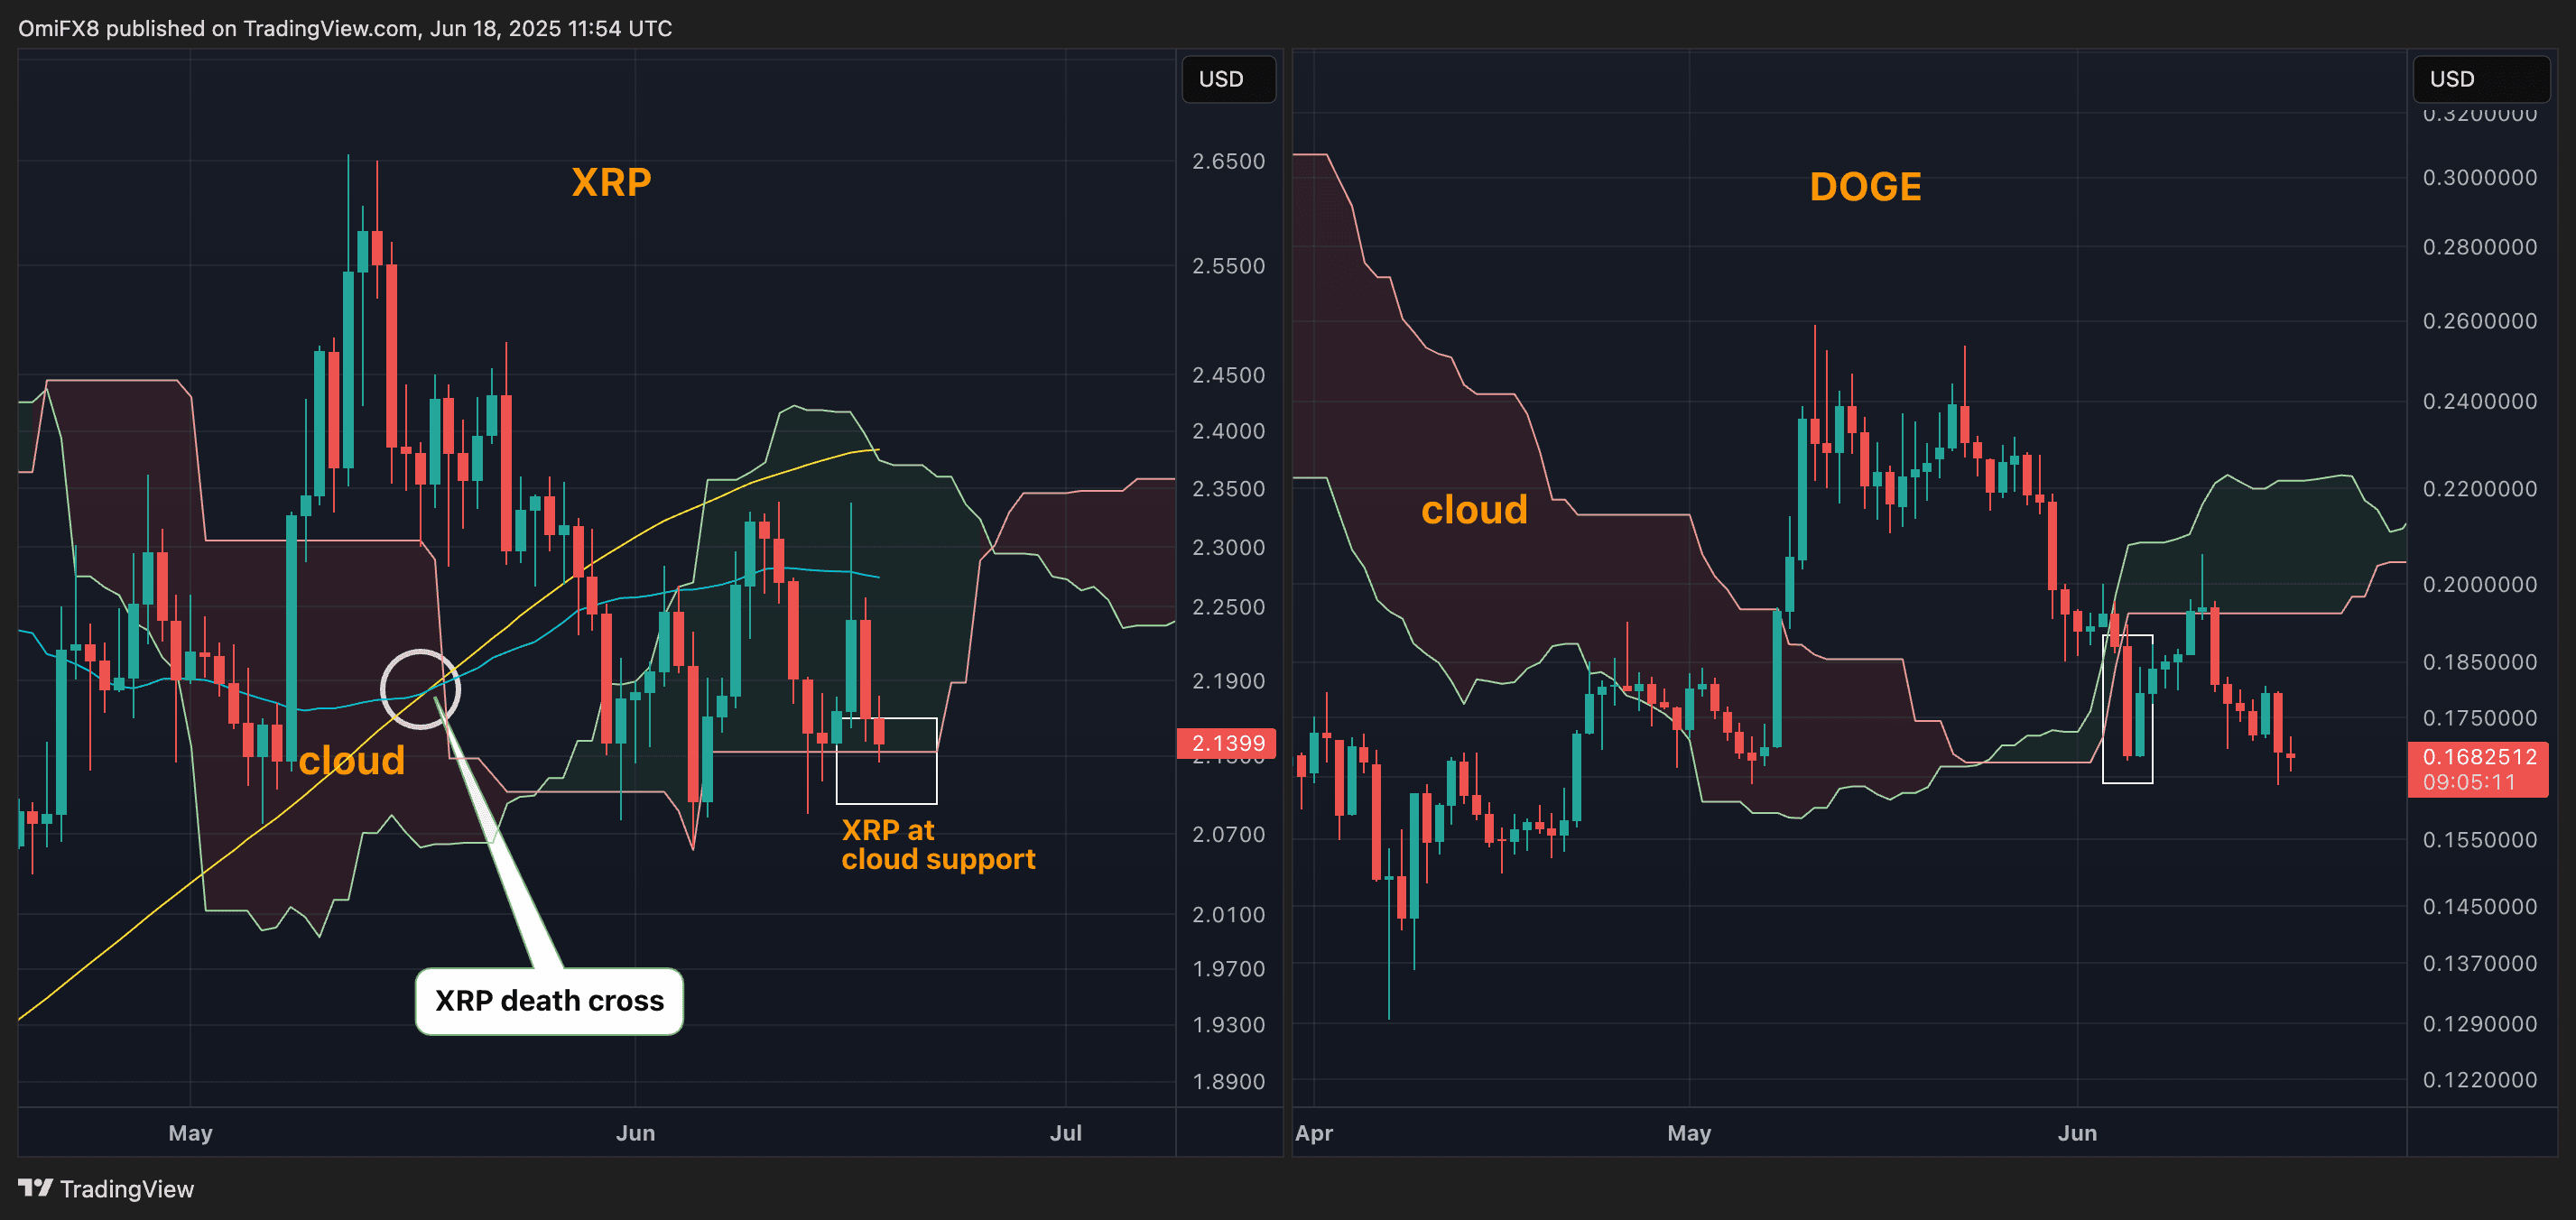
On the charts, support is seen directly at $ 1.60, the early April low. Coins like DOGE, ADA, and LINK have dropped below their respective Ichimoku clouds in recent days, resulting in price losses.